This week’s market update is going to be short and to the point. I believe much of the coming action in the weeks ahead will key on three of the Fed’s intended QE3 performance targets: the Banks, the Dollar, and Equities. And if these “targets” are a useful measuring stick, then so far, so good. The unprecedented amounts of monetary stimulus have clearly been working on a short-term basis: The banks are enjoying their booster shot, the dollar is technically broken, and equities are higher.
On a longer term basis, experiments like this open the door to wild speculation. And truth is, any economist or investor claiming to know exactly how this will play out one year, 3 years, or even 5 years from now is blowing smoke. We just don’t know… but that’s why investors have to limit their focus and follow the most important indicator available: Price.
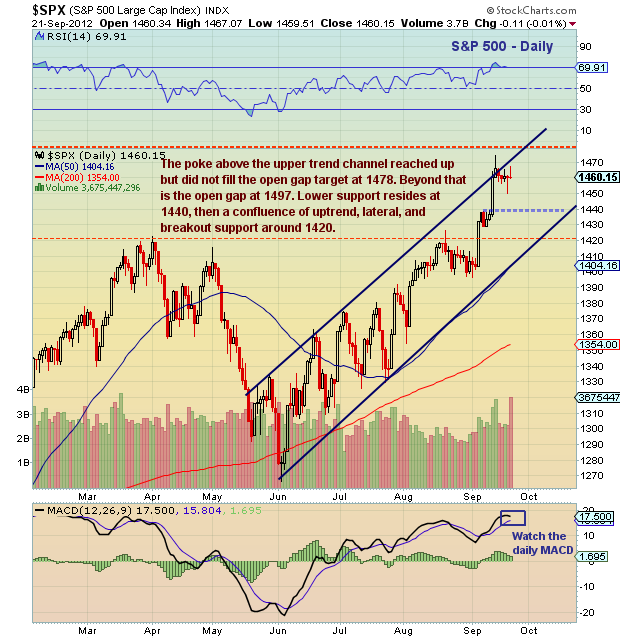
After the recent QE3 price burst higher, the S&P 500 spent the past week backing and filling. And looking at the daily S&P 500 chart below, it’s obvious that this was long overdue. Dipping as low as 1450, some may argue that the “dip” is over, however, I believe that last week’s low needs to be retested (at a minimum) and may very well give way to stronger support near 1440. On the flip side, if the dip is just a dip, and the low is in, then open gaps at 1478 and even as high as 1497 may come calling, however unlikely for this week.
S&P 500 Daily Chart:

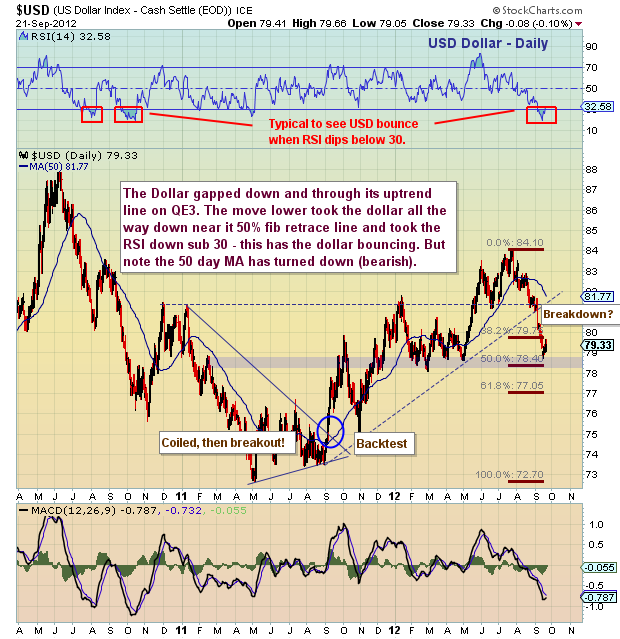
As well, much of the equity run higher is due to Fed-induced dollar weakness. In short, a weak dollar tends to be a tailwind for equity prices. And in the chart below, it’s apparent that equities have benefited greatly from a softer dollar of late. In fact, the dollar’s recent slide included a technical breakdown through its 18 month uptrend line. This puts the dollar in a weaker intermediate term condition. BUT, on a short term basis, the Dollar has hit important indicator levels that often coincide with a bounce: sub 30 RSI and a dip to the 50% Fibonacci Retracement support.
US Dollar Daily Chart:
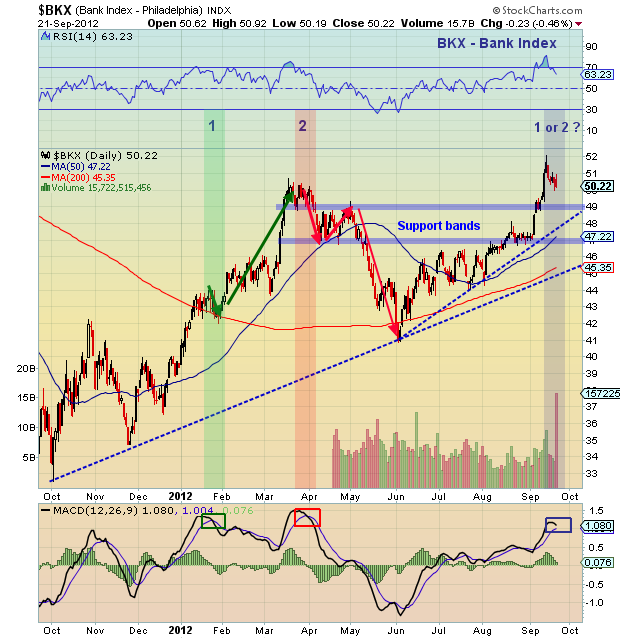
Another benefactor to the Fed’s monetary stimulus has been the banks. And similar to the overall equity markets, the Banks have raced higher into and out of the QE3 announcement… and are just now pulling in. But note the MACD dip lower in the charts below. If it continues lower, then I suspect that one of the two preceding scenarios will play out – see the chart below. This is further reason to watch the character of the price action.
The Bank Index (BKX) Daily Chart:
Disclosure: No position in any of the securities mentioned at the time of publication.
Any opinions expressed herein are solely those of the author, and do not in any way represent the views or opinions of his employer or any other person or entity.
Original post
- English (UK)
- English (India)
- English (Canada)
- English (Australia)
- English (South Africa)
- English (Philippines)
- English (Nigeria)
- Deutsch
- Español (España)
- Español (México)
- Français
- Italiano
- Nederlands
- Português (Portugal)
- Polski
- Português (Brasil)
- Русский
- Türkçe
- العربية
- Ελληνικά
- Svenska
- Suomi
- עברית
- 日本語
- 한국어
- 简体中文
- 繁體中文
- Bahasa Indonesia
- Bahasa Melayu
- ไทย
- Tiếng Việt
- हिंदी
Banks, USD, S&P 500: Three Charts To Watch
Published 09/27/2012, 07:56 AM
Updated 07/09/2023, 06:31 AM
Banks, USD, S&P 500: Three Charts To Watch
Latest comments
Loading next article…
Install Our App
Risk Disclosure: Trading in financial instruments and/or cryptocurrencies involves high risks including the risk of losing some, or all, of your investment amount, and may not be suitable for all investors. Prices of cryptocurrencies are extremely volatile and may be affected by external factors such as financial, regulatory or political events. Trading on margin increases the financial risks.
Before deciding to trade in financial instrument or cryptocurrencies you should be fully informed of the risks and costs associated with trading the financial markets, carefully consider your investment objectives, level of experience, and risk appetite, and seek professional advice where needed.
Fusion Media would like to remind you that the data contained in this website is not necessarily real-time nor accurate. The data and prices on the website are not necessarily provided by any market or exchange, but may be provided by market makers, and so prices may not be accurate and may differ from the actual price at any given market, meaning prices are indicative and not appropriate for trading purposes. Fusion Media and any provider of the data contained in this website will not accept liability for any loss or damage as a result of your trading, or your reliance on the information contained within this website.
It is prohibited to use, store, reproduce, display, modify, transmit or distribute the data contained in this website without the explicit prior written permission of Fusion Media and/or the data provider. All intellectual property rights are reserved by the providers and/or the exchange providing the data contained in this website.
Fusion Media may be compensated by the advertisers that appear on the website, based on your interaction with the advertisements or advertisers.
© 2007-2024 - Fusion Media Limited. All Rights Reserved.
