


Sign up to create alerts for Instruments,
Economic Events and content by followed authors
Free Sign Up Already have an account? Sign In
Please try another search

Accenture plc (NYSE:ACN) reported solid second-quarter fiscal 2020 results, wherein earnings and revenues surpassed the Zacks Consensus Estimate.
Earnings of $1.91 per share surpassed the consensus estimate as well as the year-ago figure by 10.4%. The bottom line benefited from higher revenues and operating results, and higher non-operating income.
Net revenues of $11.14 billion outpaced the consensus mark by 0.4% and increased 6.7% year over year on a reported basis and 8% in terms of local currency. Net revenues came in line with the higher end of the guided range of $10.85-$11.15 billion.
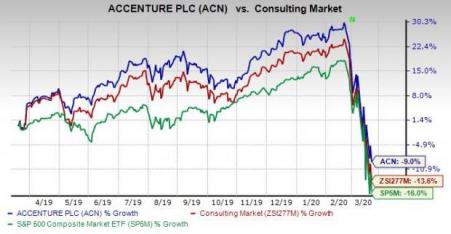
Over the past year, shares of Accenture have declined 9% compared with 13.6% loss of the industry it belongs to and 16% decline of the Zacks S&P 500 composite.
Revenues in Detail
On the basis of type of work, Consulting revenues of $6.17 billion increased 7% year over year on a reported basis and 8% in terms of local currency. Outsourcing revenues of $4.97 billion increased 6% year over year on a reported basis and 8% in terms of local currency.
Segment-wise, Communications, Media & Technology revenues of $2.24 billion increased 4% year over year on a reported basis and 5% in terms of local currency. Financial Services revenues of $2.09 billion increased 2% year over year on a reported basis and 3% in terms of local currency. Health & Public Service revenues of $1.95 billion increased 14% year over year on a reported basis and 15% in terms of local currency. Products revenues of $3.16 billion increased 9% year over year on a reported basis and 10% in local currency. Resources revenues of $1.70 billion increased 4% year over year on a reported basis and 5% in terms of local currency.
Geographically, revenues of $5.26 billion from North Americas increased 11% year over year on a reported basis as well as in terms of local currency. Revenues from Europe of $3.63 billion was flat year over year on a reported basis and increased 2% in terms of local currency. Revenues from Growth Markets of $2.26 billion increased 9% year over year on a reported basis and 11% in terms of local currency.
Booking (NASDAQ:BKNG) Trends
Accenture reported new bookings worth $14.2 billion. Consulting bookings and Outsourcing bookings totaled $7.2 billion and $7 billion, respectively.
Operating Results
Gross margin (gross profit as a percentage of net revenues) for the second quarter of fiscal 2020 increased 120 basis points (bps) to 30.2%. Operating income was $1.49 billion, up 7% year over year. Operating margin in the reported quarter expanded 10 bps to 13.4%.
Accenture PLC Price, Consensus and EPS Surprise
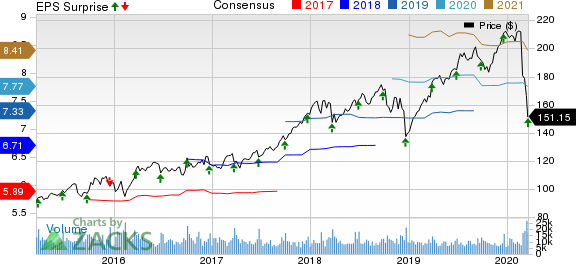 Accenture PLC Price, Consensus and EPS Surprise
Accenture PLC price-consensus-eps-surprise-chart | Accenture PLC Quote
Balance Sheet & Cash Flow
Accenture exited second-quarter fiscal 2020 with total cash and cash equivalents balance of $5.44 billion compared with $5.81 billion at the end of the prior quarter. Long-term debt was $13.8 million compared with $15.9 million at the end of the prior quarter.
Cash provided by operating activities crossed $1.53 billion in the reported quarter. Free cash flow came in at $1.37 billion.
Dividend Payout
Accenture has shifted its dividend payout policy from semi-annual to quarterly basis. On Feb 14, 2020, the company paid out a quarterly cash dividend of 80 cents per share for shareholders of record at the close of business on Jan 16, 2020. These cash dividend payouts totaled $511 million.
The company has declared a quarterly cash dividend of 80 cents per share for shareholders of record at the close of business on Apr 16, 2020. This dividend will be paid out on May 15, 2020.
In fiscal 2019, the company paid out semi-annual cash dividends of $1.46 per share.
Share Repurchases
In line with the policy of returning cash to its shareholders, Accenture repurchased 4.7 million shares for $970 million in the fiscal second quarter. The company had approximately 637 million total shares outstanding as of Feb 29, 2020.
Guidance
Third-Quarter Fiscal 2020
For third-quarter fiscal 2020, Accenture expects revenues of $10.75-$11.15 billion. The assumption is inclusive of a negative foreign-exchange impact of 1.5%. Notably, the Zacks Consensus Estimate of $11.10 billion lies within the current guided range.
Fiscal 2020
Accenture lowered its guidance for fiscal 2020. Management now expects EPS in the range of $7.48-$7.70 compared with the prior guided range of $7.66-$7.84. The current Zacks Consensus Estimate of $7.78 lies above the updated guidance. Revenues are expected to register 3-6% growth in terms of local currency compared with the prior guided growth rate of 6-8%.
Operating margin for the fiscal year is expected between 14.7% and 14.8%, indicating an expansion of 10-20 bps from fiscal 2019 compared with the prior expansion of 10-30 bps.
The company expects negative foreign exchange impact of 1.5% on its results in U.S. dollars compared with 1% negative impact as expected earlier.
Operating cash flow is now anticipated in the range of $6.15-$6.65 billion compared with $6.35-$6.75 billion guided earlier. Free cash flow is now expected between $5.5 billion and $6 billion compared with prior guidance of $5.7-$6.1 billion. Annual effective tax rate of 23.5-25.5% is expected.
Zacks Rank & Stocks to Consider
Currently, Accenture carries a Zacks Rank #3 (Hold).
Some better-ranked stocks in the broader Zacks Business Services sector are Omnicom (NYSE:OMC) , TransUnion (NYSE:TRU) and Genpact (NYSE:G) , each carrying a Zacks Rank #2 (Buy). You can see the complete list of today’s Zacks #1 Rank (Strong Buy) stocks here.
Long-term expected EPS (three to five years) growth rate for Omnicom, TransUnion and Genpact is 5.6%, 12.8% and 13.9%, respectively.
Breakout Biotech Stocks with Triple-Digit Profit Potential
The biotech sector is projected to surge beyond $775 billion by 2024 as scientists develop treatments for thousands of diseases. They’re also finding ways to edit the human genome to literally erase our vulnerability to these diseases.
Zacks has just released Century of Biology: 7 Biotech Stocks to Buy Right Now to help investors profit from 7 stocks poised for outperformance. Our recent biotech recommendations have produced gains of +50%, +83% and +164% in as little as 2 months. The stocks in this report could perform even better.
See these 7 breakthrough stocks now>>
The fortune of Nvidia (NASDAQ:NVDA) is closely tied to Big Tech hyperscalers. Although the AI/GPU designer didn’t name its largest clients in the latest 10-K filing on Wednesday,...
In a market fraught with uncertainty, investors often seek refuge in defensive-minded stocks that offer stability and resilience. Two such stalwarts, Johnson & Johnson and...
The United States is the largest exporter of liquefied natural gas (LNG), having surpassed Australia and Qatar in 2023. The United States exports an estimated 12.5 billion cubic...
Are you sure you want to block %USER_NAME%?
By doing so, you and %USER_NAME% will not be able to see any of each other's Investing.com's posts.
%USER_NAME% was successfully added to your Block List
Since you’ve just unblocked this person, you must wait 48 hours before renewing the block.
I feel that this comment is:
Thank You!
Your report has been sent to our moderators for review
Add a Comment
We encourage you to use comments to engage with other users, share your perspective and ask questions of authors and each other. However, in order to maintain the high level of discourse we’ve all come to value and expect, please keep the following criteria in mind:
Enrich the conversation, don’t trash it.
Stay focused and on track. Only post material that’s relevant to the topic being discussed.
Be respectful. Even negative opinions can be framed positively and diplomatically. Avoid profanity, slander or personal attacks directed at an author or another user. Racism, sexism and other forms of discrimination will not be tolerated.
Perpetrators of spam or abuse will be deleted from the site and prohibited from future registration at Investing.com’s discretion.