
- All Instrument Types
- Indices
- Equities
- ETFs
- Funds
- Commodities
- Currencies
- Crypto
- Bonds
- Certificates
Please try another search

Tech Steals Stock Market Energy; Retail Takes A Hit

AT40 = 52.7% of stocks are trading above their respective 40-day moving averages (DMAs)
AT200 = 55.6% of stocks are trading above their respective 200DMAs
VIX = 11.1 (flat) (volatility index)
Short-term Trading Call: neutral
Commentary
Tech was back on Monday sucking energy out of other parts of the stock market. The NASDAQ increased 0.4%, and the PowerShares QQQ ETF (NASDAQ:QQQ) increased 0.7%. The S&P 500 (via SPDR S&P 500 (NYSE:SPY)) barely eked out a gain at 0.1%. Yet, AT40 (T2108), the percentage of stocks trading above their respective 40-day moving averages (DMAs), declined slightly by 2 percentage points to 52.7%.
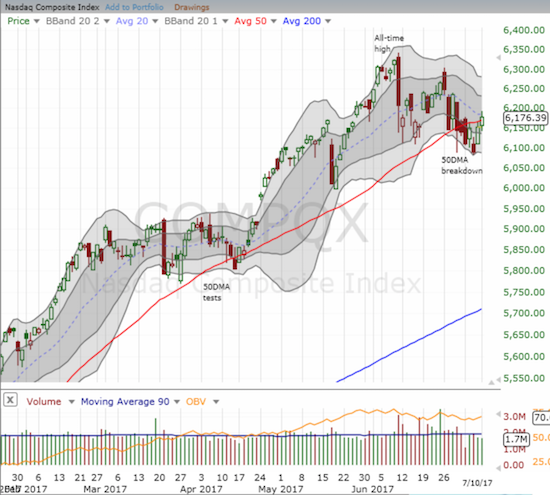
The NASDAQ managed to close above its 50DMA in an attempt to resume its bullish positioning.
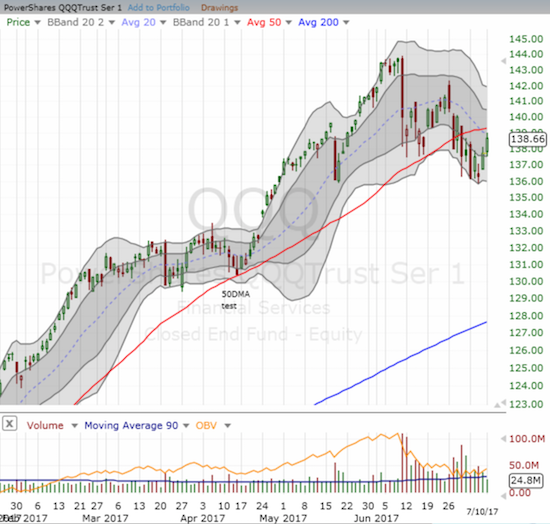
While trading volume shrank, the PowerShares QQQ ETF (QQQ) rallied just short of its 20DMA. The 50DMA looms overhead as additional resistance.
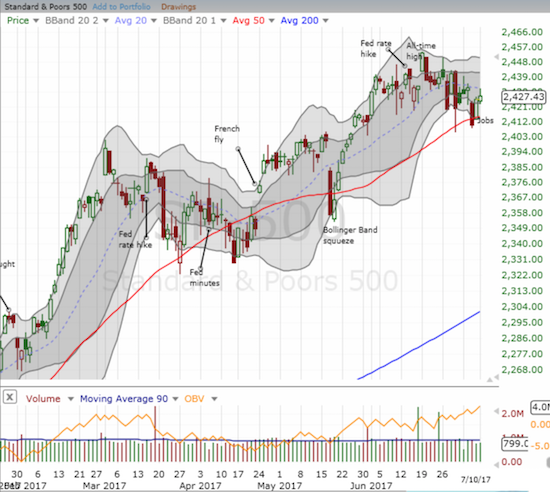
The S&P 500 (SPY) faded from its now downtrending 20DMA. This move leaves another 50DMA test still in play.
The apt representation of the sucking sound was Amazon.com (NASDAQ:AMZN) which was on the eve of raking in big dollars from its much anticipated Amazon Prime Day. AMZN popped 1.8% in a move that confirmed a 50DMA breakout and reconfirmed the 50DMA as uptrending support. On the other side of the ledger was the SPDR S&P Retail ETF (NYSE:XRT) and its 2.4% loss to a (marginal) new 17-month low.
Macy’s (NYSE:M) was just minding its business and lost 7.1% to a near 7-year low on heavy trading volume just for being one of the many hapless retailers looking like sitting ducks on Prime Day eve (ok, MAYBE it had something to do with sympathy for Abercrombie & Fitch's (NYSE:ANF) 21% loss after announcing there is no buy-out on the horizon).
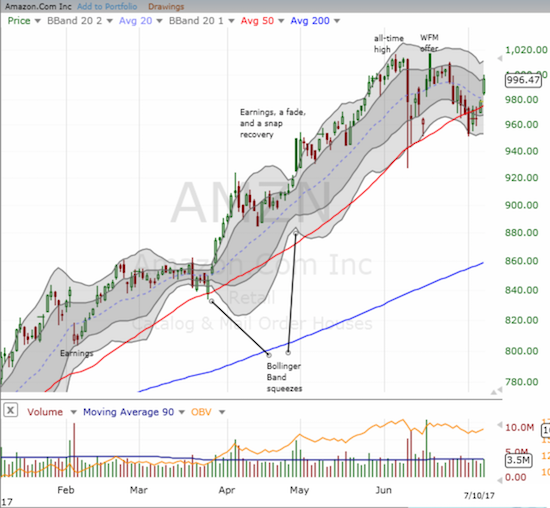
Amazon.com (AMZN) is back in prime bullish form with a gap up that reconfirmed 50DMA support.
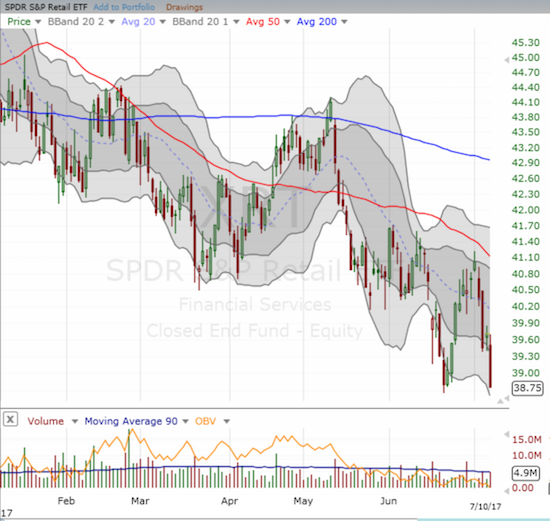
The SPDR S&P Retail ETF (XRT) broke down to new lows.
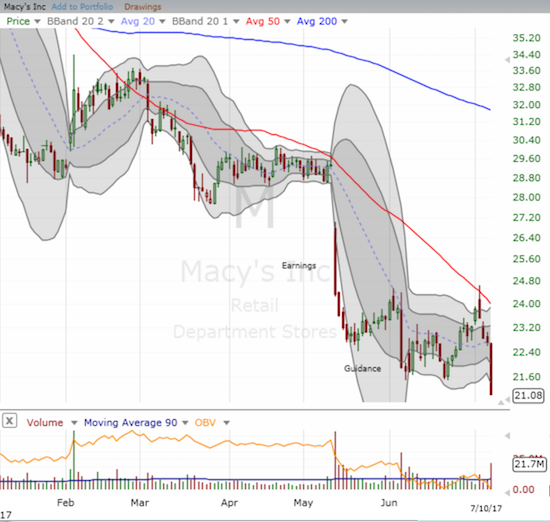
Macy’s (M) confirmed 50DMA resistance in a big way as its post-guidance relief rally came to a crashing end.
With AMZN gapping up at the open, I traded on near automatic and bought a call option with a $1000 strike. I set a sell limit for a 40%+ gain and was first pleasantly surprised that the trade triggered within two hours and was second a bit disappointed I did not reach for more as the call option ended the day with a 130% gain. I will be looking for any signs of a “sell the news” reaction after Prime Day ends. (In related trades, later in the day, I locked in profits on my latest tranche of QQQ call options. Anticipating the yo-yo to go back down, I doubled down on my Apple (NASDAQ:AAPL) puts but did not add to the Netflix (NASDAQ:NFLX) put options).
Just for emphasis, Best Buy (NYSE:BBY) got pummeled on the heels of more Amazon panic. News headlines spread quickly about Amazon Smart Home Services which reportedly rivals Best Buy’s Geek Squad. On this news alone, BBY lost 6.3% and broke down below its 50DMA support. BBY lost $1B in market cap for a threat to a business that was at most $1.8B in revenue in fiscal 2017 or 5% of the total (according to BBY’s annual report).
While the sell-off seems overdone given the Geek Squad’s revenue size, it is certainly possible that the run-up to an all-time high in late May was the move that was overdone. For example, BBY’s revenue has flatlined the past three fiscal years: 0.6% annual growth for fiscal 2015, 0.9% for 2016, and -0.3%for 2017. For FY 2018, BBY guided to 1.0% enterprise revenue growth on a 52-week basis. With these kinds of numbers any revenue loss with a billion on the end can be precious.
Regardless, my technical trade here is pretty straightforward: 1) go short on the breakdown and hold, 2) stop out shorts and/or go long on a confirmed fresh breakout above the 50DMA and hang around for a gap fill.
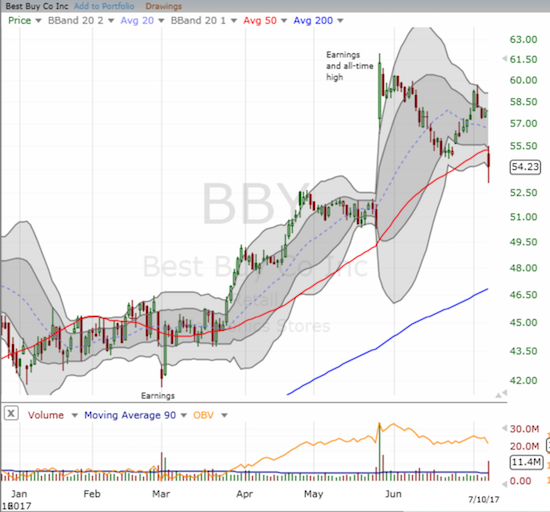
Best Buy (BBY) plunged below 50DMA support. Can it bounce back and relive the momentum that took it to an all-time high in May?
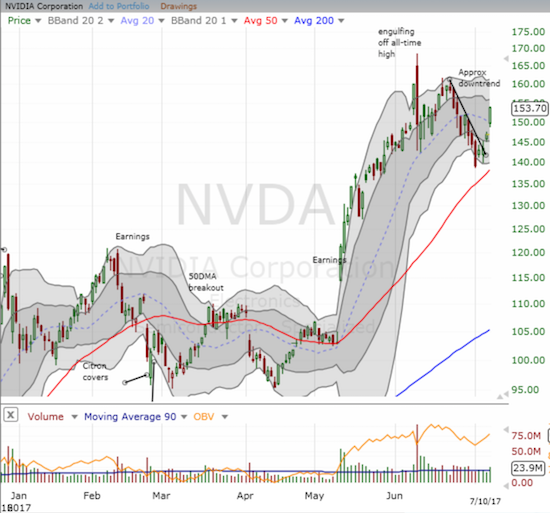
AMZN was not the only one of the usual suspects to enjoy a breakout. NVIDIA Corporation (NASDAQ:NVDA) confirmed its breakout from a short-term downtrend with a 4.7% gain. NVDA joined AMZN and Facebook (NASDAQ:FB) as part of the usual suspects that are back in bullish mode.
Nvidia (NVDA) ripped higher and looks like it is back in bullish form.
Finally, a LONG overdue trading update on IHS Markit (NASDAQ:INFO). In late May, INFO jumped nicely on news it would join the S&P 500. At the time, I was hopeful that the index could help INFO retain its gains. Such was not the case. While the index is marginally higher since then, INFO has given up all its gains and then some. I am definitely disappointed, but I fully recognize that these kinds of gains are hard to sustain. Still, this is just one of those stocks that has earned my stubbornness. I am holding for the 200DMA uptrend and am prepared to buy near that level as a gift from the market. I would have bailed on INFO on the 50DMA breakdown if I had bought it for a short-term trade. My position is back to flat-line.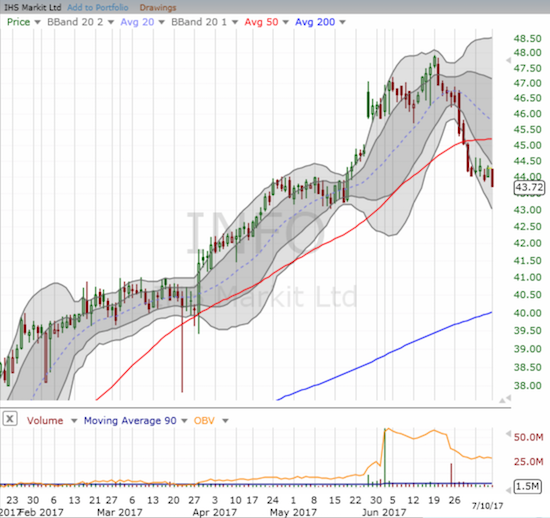
It looks like IHS Markit Ltd. (INFO) has topped out for now as 50DMA support failed to keep the stock aloft.
Daily AT40 (T2108)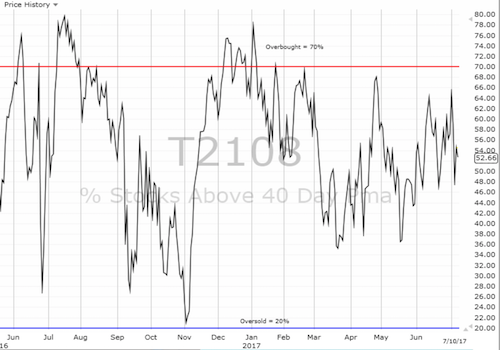
Black line: AT40 (T2108) (% measured on the right)
Red line: Overbought threshold (70%); Blue line: Oversold threshold (20%)
Weekly AT40 (T2108)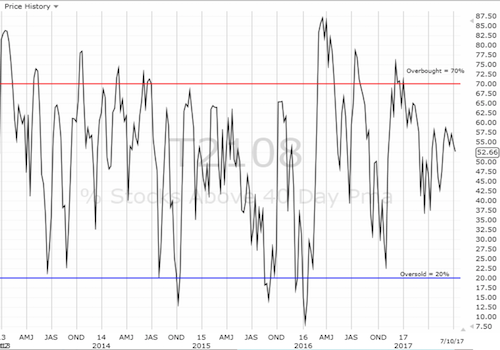
Be careful out there!
Full disclosure: long NVDA call spread and puts, long AAPL puts, long NFLX puts
Related Articles

If you can keep your emotions in check, the volatility in stocks sets up a long-term buying opportunity. However, investors with a lower risk tolerance may want to consider...

Let’s get right to it. First a quick comment on the weekly charts. The Russell 2000 (IWM) (Gramps) is at a key life support level on the 200-week moving average. Grandma...

While market cap weighting is still the go-to for many investors due to its low cost and low turnover, it's becoming increasingly fragile these days thanks to the concentration...
Are you sure you want to block %USER_NAME%?
By doing so, you and %USER_NAME% will not be able to see any of each other's Investing.com's posts.
%USER_NAME% was successfully added to your Block List
Since you’ve just unblocked this person, you must wait 48 hours before renewing the block.
I feel that this comment is:
Thank You!
Your report has been sent to our moderators for review



Add a Comment
We encourage you to use comments to engage with other users, share your perspective and ask questions of authors and each other. However, in order to maintain the high level of discourse we’ve all come to value and expect, please keep the following criteria in mind:
Enrich the conversation, don’t trash it.
Stay focused and on track. Only post material that’s relevant to the topic being discussed.
Be respectful. Even negative opinions can be framed positively and diplomatically. Avoid profanity, slander or personal attacks directed at an author or another user. Racism, sexism and other forms of discrimination will not be tolerated.
Perpetrators of spam or abuse will be deleted from the site and prohibited from future registration at Investing.com’s discretion.