


Sign up to create alerts for Instruments,
Economic Events and content by followed authors
Free Sign Up Already have an account? Sign In
Please try another search

After being trapped in a narrow range between $45 and $55 per barrel for 12 months, oil prices finally broke out in November to hit their highest levels in more than two years. The commodity was supported by a variety of catalysts, including the OPEC-led production cut extension, lower inventory overhang and the temporary shutdown of a key pipeline connecting Canada to the United States.
What’s encouraging is that the price appreciation extends an upbeat tone in crude trade into December following the third monthly gain in a row by the futures contracts, the longest such streak since early 2016. To be precise, the commodity rose about 5.6% in November to end the month at $57.40 per barrel.
3 Reasons for Oil's November Surge
Production Cut Deal Extension: One of the significant reasons why the U.S. oil benchmark soared, revolved around expectations that OPEC and other major producers will agree to expand their output-cut deal beyond March. True to predictions, the coalition prolonged the current dynamic for another nine months to the end of 2018.
The agreement, now renewed twice, keeps 1.8 million barrels a day (or 2% of global supply) off the market in an attempt to clear a supply glut. While there are several question marks over the degree to which the cartel members are adhering to their quotas, there's no ignoring the fact that the cuts continue to narrow the market imbalances. What’s more,
Sharp Inventory Drawdowns: Investors have pinned hopes of recovery over the recent U.S. Energy Department's inventory releases that show multiple weeks of strong inventory draws in the domestic crude stockpiles – pointing to a slowdown in shale output. The nation's oil stockpiles have shrunk in 26 of the last 33 weeks and are down almost 80 million barrels since April.
Keystone Pipeline Spill: The temporary shutdown of TransCanada Corp’s (TO:TRP) 590,000 barrel-per-day Keystone oil pipeline – one of the largest from Canada to the United States – due to a leak and subsequent cleanup operations, was also bullish for oil prices.
How to Identify the Outperformers?
The strong November rally does not necessarily indicate that all energy scrips would be wise picks. Moreover, with a wide range of energy firms thronging the investment space, it is by no means an easy task for investors to arrive at stocks that have the potential to deliver attractive returns. While it is impossible to be sure about such outperformers, this is where the Zacks Rank, which justifies a company’s strong fundamentals, can come in really handy.
In particular, we have shortlisted 5 companies that have outperformed oil prices over the past 4 weeks, and have a Zacks Rank of #1 (Strong Buy) or #2 (Buy). You can see the complete list of today’s Zacks #1 Rank (Strong Buy) stocks here.
Finally, the chosen ones have VGM Score less than or equal to B. Here V stands for Value, G for Growth and M for Momentum and the score is a weighted combination of these three scores. Such a score allows you to eliminate the negative aspects of stocks and select winners. However, it is important to keep in mind that each Style Score will carry a different weight while arriving at a VGM score.
Our research shows that stocks with a VGM Score of A or B when combined with a Zacks Rank #1 or #2 offer the best upside potential.
5 Choices
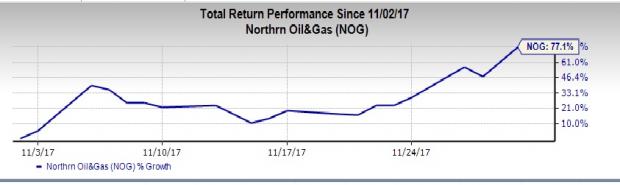
Northern Oil and Gas, Inc. (NYSE:NOG) , a #1 Ranked stock, is our first pick. A non-operator explorer and producer with primary focus on the Williston Basin in North Dakota and Montana, Minnetonka, MN-based Northern Oil and Gas has a VGM Score of B. Also, shares of the company have gained 77.1% in the past four weeks.
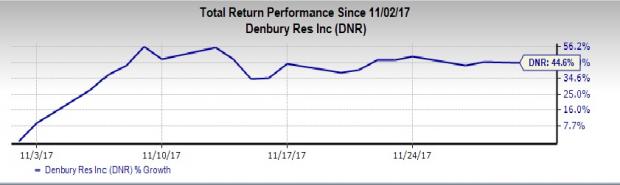
Our second choice is Denbury Resources Inc. (NYSE:DNR) – a company engaged in the acquisition, development, operation and exploration of oil and natural gas properties in the Gulf Coast and Rocky Mountain regions of the U.S. This Plano, TX-based Zacks Rank #1 stock, sporting a VGM Score of A, has risen 44.6% in past month.
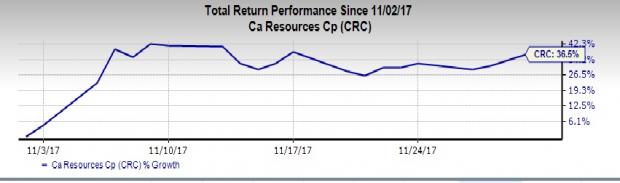
Then we have California Resources Corp. (NYSE:CRC) . Headquartered in Los Angeles, CA, California Resources is an independent oil and gas company having operations mainly in the San Joaquin Basin. This Zacks Rank #2 stock, sporting a VGM Score of A, is up 36.5% in the past four weeks.
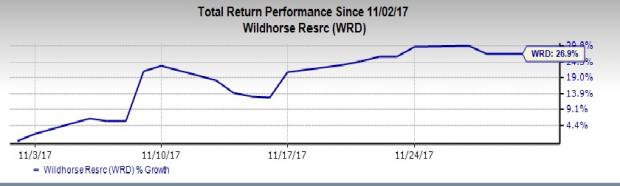
WildHorse Resource Development Corp. (NYSE:WRD) is another company we recommend. Headquartered in Houston, TX, WildHorse Resource Development is focused on the acquisition, development, exploration and operation of unconventional, onshore oil and gas properties in the northeastern end of the Eagle Ford Play in South Texas. The company carries a Zacks Rank of #2 with a VGM Score of B. Also, shares of the company have gained 26.9% since the start of November.
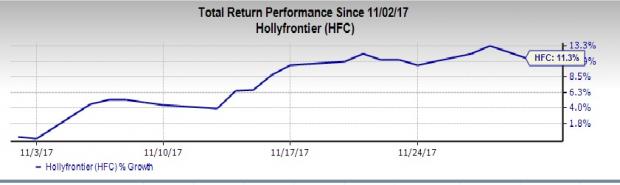
Finally, there is HollyFrontier Corp. (NYSE:HFC) . Headquartered in Dallas, TX, is one of the largest independent refiners and marketers of petroleum products in the U.S. The Zacks #2 Ranked stock, which has gained 11.3% in past month, has a VGM Score of A.
5 Medical Stocks to Buy Now
Zacks names 5 companies poised to ride a medical breakthrough that is targeting cures for leukemia, AIDS, muscular dystrophy, hemophilia and other conditions.
New products in this field are already generating substantial revenue and even more wondrous treatments are in the pipeline. Early investors could realize exceptional profits.
Click here to see the 5 stocks >>
The fortune of Nvidia (NASDAQ:NVDA) is closely tied to Big Tech hyperscalers. Although the AI/GPU designer didn’t name its largest clients in the latest 10-K filing on Wednesday,...
Home improvement retailers Lowe’s (NYSE:LOW) and Home Depot (NYSE:HD) turned a corner, and their Q4 2024 earnings reports confirmed it. The corner is a return to comparable store...
One of our old flames, a former Contrarian Income Portfolio holding, has pulled back sharply in recent weeks. Time to buy the dip in this 4.3% dividend? Let’s discuss. Kinder...
Are you sure you want to block %USER_NAME%?
By doing so, you and %USER_NAME% will not be able to see any of each other's Investing.com's posts.
%USER_NAME% was successfully added to your Block List
Since you’ve just unblocked this person, you must wait 48 hours before renewing the block.
I feel that this comment is:
Thank You!
Your report has been sent to our moderators for review
Add a Comment
We encourage you to use comments to engage with other users, share your perspective and ask questions of authors and each other. However, in order to maintain the high level of discourse we’ve all come to value and expect, please keep the following criteria in mind:
Enrich the conversation, don’t trash it.
Stay focused and on track. Only post material that’s relevant to the topic being discussed.
Be respectful. Even negative opinions can be framed positively and diplomatically. Avoid profanity, slander or personal attacks directed at an author or another user. Racism, sexism and other forms of discrimination will not be tolerated.
Perpetrators of spam or abuse will be deleted from the site and prohibited from future registration at Investing.com’s discretion.