


Sign up to create alerts for Instruments,
Economic Events and content by followed authors
Free Sign Up Already have an account? Sign In
Please try another search

Xperi Corporation (NASDAQ:XPER) reported third-quarter adjusted earnings of 30 cents per share, missing the Zacks Consensus Estimate by 6 cents.
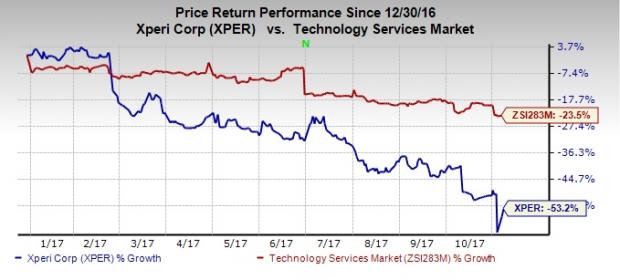
Since the third-quarter earnings release on Nov 2, the share price is down 8.0%. Notably, on a year-to-date basis, the company’s shares have lost 53.2% compared with the 23.5% loss of the industry it belongs to.
The poor results were due to weakness in a few of its markets, namely imaging. The company witnessed increasing internal competition for its low-end products. Other problems which negatively impacted third-quarter results were customer-specific issues, competition in the mobile market and expected execution of certain new licenses.
However, Tessera has intensified its IP licensing efforts and is currently working with a number of semiconductor manufacturers and OSATs to enhance its portfolio of advanced packaging and interconnect technologies. Moreover, the company remains confident about a favorable resolution of the Broadcom (NASDAQ:AVGO) matter.
Revenues
Tessera’s revenues of $88.5 million increased 41.8% year over year. However, revenues were below the company’s guidance range of $90-$97 million.
Margins
Owing to high percentage of licensing revenues, Tessera usually generates strong gross margins. Accordingly, Tessera’s third-quarter gross margin was 98.1%, down 30 basis points from 98.4% reported in the year-ago quarter.
Tessera’s operating expenses (research, development and other related costs & selling, general and administrative) were $59.8 million, up 183.4% year over year. Also, as a percentage of sales, both the expenses increased on a year-over-year basis.
Net Income
Pro forma net earnings were $15.9 million or earnings of 30 cents per share compared with $28.6 million or 57 cents in the year-ago quarter.
On a GAAP basis, net loss was $12.1 million or a loss of 24 cents per share against net earnings of $23.8 million or of 48 cents in third-quarter 2016.
Balance Sheet and Cash Flow
At quarter end, cash, cash equivalents and short-term investments were $1.49 billion, up from $1.28 billion from the prior quarter.
Dividend/Share Repurchase
During the quarter, the company approved a regular quarterly dividend of $0.20 per share, payable on Dec 13, 2017, to stockholders of record on Nov 22, 2017.
During the third quarter, the company repurchased approximately 0.4 million shares for an aggregate amount of $10 million. As of Sep 30, 2017, it still had approximately $148.2 million remaining under its current repurchase program.
4Q Guidance
For the fourth quarter of 2017, Tessera expects GAAP revenues in the range of $83-$138 million. GAAP loss per share is expected between (30) cents and 33 cents and non-GAAP loss per share is projected in the range of 29-78 cents.
For 2017, the company expects revenues in the range of $330-$385 million, down from $370-$445 million.
Tessera Holding Corporation Price, Consensus and EPS Surprise
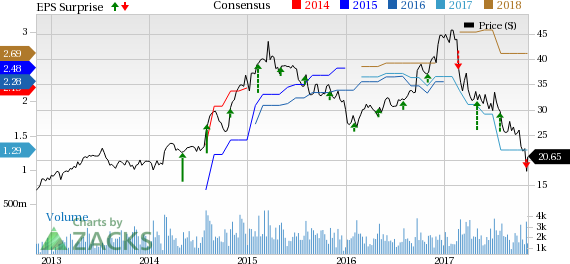
Tessera Holding Corporation Price, Consensus and EPS Surprise | Tessera Holding Corporation Quote
Other Stocks to Consider
Currently, Xperi has a Zacks Rank #5 (Strong Sell). A few better-ranked stocks in the broader technology sector are NVIDIA Corporation (NASDAQ:NVDA) and SMART Global Holdings, Inc. (NASDAQ:SGH) , each sporting a Zacks Rank #1 (Strong Buy), while Applied Materials, Inc. (NASDAQ:AMAT) , carrying a Zacks Rank #2 (Buy). You can see the complete list of today’s Zacks #1 Rank stocks here.
Wall Street’s Next Amazon (NASDAQ:AMZN)
Zacks EVP Kevin Matras believes this familiar stock has only just begun its climb to become one of the greatest investments of all time. It’s a once-in-a-generation opportunity to invest in pure genius.
Tesla (NASDAQ:TSLA) (NYSE: TSLA), the electric vehicle giant, has recently experienced a significant drop in its stock value, which has fallen nearly 45% since December. This...
Through many years of frustration among gold bugs due to the failure of gold stock prices to leverage the gold prices in a positive way, there were very clear reasons for that...
I know there is the smell of fear in the air when I see my readership double as we reach a point where weekly chart factors come into play. Up until last week, markets have...
Are you sure you want to block %USER_NAME%?
By doing so, you and %USER_NAME% will not be able to see any of each other's Investing.com's posts.
%USER_NAME% was successfully added to your Block List
Since you’ve just unblocked this person, you must wait 48 hours before renewing the block.
I feel that this comment is:
Thank You!
Your report has been sent to our moderators for review
Add a Comment
We encourage you to use comments to engage with other users, share your perspective and ask questions of authors and each other. However, in order to maintain the high level of discourse we’ve all come to value and expect, please keep the following criteria in mind:
Enrich the conversation, don’t trash it.
Stay focused and on track. Only post material that’s relevant to the topic being discussed.
Be respectful. Even negative opinions can be framed positively and diplomatically. Avoid profanity, slander or personal attacks directed at an author or another user. Racism, sexism and other forms of discrimination will not be tolerated.
Perpetrators of spam or abuse will be deleted from the site and prohibited from future registration at Investing.com’s discretion.