


Sign up to create alerts for Instruments,
Economic Events and content by followed authors
Free Sign Up Already have an account? Sign In
Please try another search

It has been about a month since the last earnings report for Twenty-First Century Fox, Inc. (NASDAQ:FOXA) . Shares have added about 2.7% in that time frame.
Will the recent positive trend continue leading up to its next earnings release, or is FOXA due for a pullback? Before we dive into how investors and analysts have reacted as of late, let's take a quick look at the most recent earnings report in order to get a better handle on the important drivers.
21st Century Fox Q2 Earnings & Sales Beat Estimates
Twenty-First Century Fox delivered better-than-expected earnings for the seventh straight quarter, when it reported second-quarter fiscal 2018 results. The company’s adjusted earnings from continuing operations came in at 42 cents, beating the Zacks Consensus Estimate of 36 cents. However, earnings declined 20.8% year over year.
Including one-time items, earnings came in at 99 cents a share compared with 46 cents reported in the prior-year quarter.
Notably, the top line not only increased 5% year over year but also surpassed the Zacks Consensus Estimate for the third straight quarter. Revenues of $8,037 million came ahead of the consensus mark of $7,968 million on account of robust affiliate and advertising revenues at the Cable Network Programming, marginally offset by decline in revenues at Television segment. It was also aided by increase in syndication revenues at the Cable Network Programming.
Segment wise, Cable Network Programming revenues jumped 11% to $4,405 million on the back of robust affiliate as well as advertising revenue growth, which overshadowed 15% gain in costs. Rise in expenses was primarily due to higher global sports programming costs.
Filmed Entertainment revenues were down 1% to $2,246 million, while Television segment net revenues decreased 5.8% to $1,806 million, both on a year-over-year basis.
The company’s total segment operating income before depreciation and amortization (OIBDA) came in at $1,438 million, down 27.9% year over year. Increase in OBIDA from Cable Network Programming was negated by decline in OIBDA from Television, Film Entertainment and Other, Corporate and Eliminations.
Detailed Discussion
OIBDA at Cable Network Programming rose 2.6% to $1,365 million owing to 11% increase in revenues. The increase was partially offset by 15% rise in expenses on account of increase in global sports programming costs.
OIBDA contribution from domestic rose 1% year over year due to increase in contribution form Fox News, which mitigated dismal performance at domestic sports networks as well as National Geographic. At the domestic cable channels, affiliate revenues grew 12% owing to rise in contractual rate across all domestic brands. Domestic advertising revenues declined 3% year over year primarily due to fall in general entertainment ratings.
OIBDA contribution from International cable channels jumped 8% year over year as strong performance at FNG International and STAR entertainment networks overshadowed decline at STAR sports networks. Affiliate revenues advanced 13% owing to increase in rates and subscribers growth at both FNG International as well as STAR India. International advertising revenues rose 14% primarily owing to high-double digit advertising growth at STAR India and improvement at FNG International.
Filmed Entertainment’s OIBDA slumped 66% to $131 million on account of higher theatrical releasing costs.
Television segment’s OIBDA plunged 85% to $56 million on account of increase in contractual sports programming costs at the FOX Broadcast Network and lower revenues.
Other Financial Details
Twenty-First Century Fox ended the quarter with cash and cash equivalents of $5,809 million. Total borrowings came in at $19,163 million and shareholders’ equity, excluding non-controlling interest of $1,242 million, was $18,389 million
How Have Estimates Been Moving Since Then?
In the past month, investors have witnessed a downward trend in fresh estimates. There has been one revision higher for the current quarter compared to five lower.
Twenty-First Century Fox, Inc. Price and Consensus
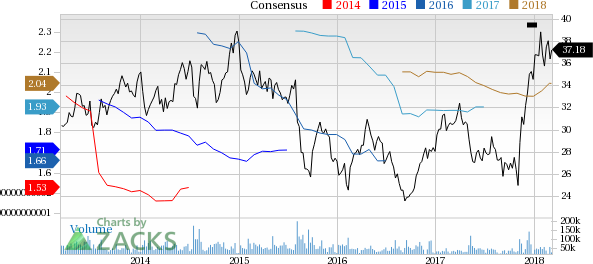
Twenty-First Century Fox, Inc. Price and Consensus | Twenty-First Century Fox, Inc. Quote
VGM Scores
At this time, FOXA has a poor Growth Score of F, however its Momentum is doing a bit better with a D. The stock was allocated a grade of C on the value side, putting it in the middle 20% for this investment strategy.
Overall, the stock has an aggregate VGM Score of D. If you aren't focused on one strategy, this score is the one you should be interested in.
The company's stock is suitable solely for value based on our styles scores.
Outlook
Estimates have been broadly trending downward for the stock and the magnitude of these revisions indicates a downward shift. Interestingly, FOXA has a Zacks Rank #3 (Hold). We expect an in-line return from the stock in the next few months.
In a market fraught with uncertainty, investors often seek refuge in defensive-minded stocks that offer stability and resilience. Two such stalwarts, Johnson & Johnson and...
Bitcoin has gained legitimacy as it has achieved mainstream status these days. Even the United States Securities and Exchange Commission (SEC) has acknowledged its legitimacy with...
Stocks fell sharply, with the S&P 500 leading the decline, finishing the day down almost 1.6% at 5,860. Meanwhile, the Nasdaq 100 dropped nearly 2.75%, closing at 20,550. This...
Are you sure you want to block %USER_NAME%?
By doing so, you and %USER_NAME% will not be able to see any of each other's Investing.com's posts.
%USER_NAME% was successfully added to your Block List
Since you’ve just unblocked this person, you must wait 48 hours before renewing the block.
I feel that this comment is:
Thank You!
Your report has been sent to our moderators for review
Add a Comment
We encourage you to use comments to engage with other users, share your perspective and ask questions of authors and each other. However, in order to maintain the high level of discourse we’ve all come to value and expect, please keep the following criteria in mind:
Enrich the conversation, don’t trash it.
Stay focused and on track. Only post material that’s relevant to the topic being discussed.
Be respectful. Even negative opinions can be framed positively and diplomatically. Avoid profanity, slander or personal attacks directed at an author or another user. Racism, sexism and other forms of discrimination will not be tolerated.
Perpetrators of spam or abuse will be deleted from the site and prohibited from future registration at Investing.com’s discretion.