


Sign up to create alerts for Instruments,
Economic Events and content by followed authors
Free Sign Up Already have an account? Sign In
Please try another search

A month has gone by since the last earnings report for Nucor Corporation (NYSE:NUE) . Shares have lost about 6.7% in that time frame, underperforming the market.
Will the recent negative trend continue leading up to the stock's next earnings release, or is it due for a breakout? Before we dive into how investors and analysts have reacted of late, let's take a quick look at the most recent earnings report in order to get a better handle on the important drivers.
Nucor's Q3 Earnings Beat Estimates, Revenues Miss
Nucor saw its profits (on a reported basis) decline year over year in the third-quarter 2017, but its earnings beat expectations.
The company logged a profit of $268.5 million or 83 cents per share for the third quarter, compared to earnings of $305.4 million or 95 cents per share it registered a year ago. Earnings include a one-time gain of $13.2 million or 4 cents. Barring one-time items, earnings per share for the reported quarter were 79 cents, which surpassed the Zacks Consensus Estimate of 78 cents.
Revenues increased roughly 20.5% year over year to $5,170.1 million in the reported quarter from $4,290.2 million, but missed the Zacks Consensus Estimate of $5,276 million.
Operating Stats
Total steel mills shipments in the third quarter were 6,165,000 tons, up 18% year over year. Total tons shipped to outside customers were up 12% year over year to 6,618,000 tons. Average sales price in the quarter were up 7% year over year.
Steel mill operating rates decreased to 83% in the reported quarter from 88% a year ago.
Segment Highlights
Nucor witnessed decreased profitability in its Steel Mills segment in the third quarter compared with the previous quarter. According to the company, higher utilization rates at its sheet mills unit were offset by continued pressure from imports, which prevented prices from maintaining pace with rising cost of raw materials. The performance of plate mills also decreased considerably on a sequential basis.
The performance of Nucor’s Raw Materials segment in the third quarter decreased compared with the second due to due to unplanned outages in its Louisiana plant during most of the quarter.
Nucor also witnessed improved profitability in its downstream products segment on a sequential comparison basis in the third quarter on the back of higher selling price and volumes.
Financial Position
Nucor ended the quarter with cash and cash equivalents of around $1,575.9million, down roughly 7.6% from $1,704.7 million a year ago. Long-term debt was $3,241.5 million, down around 25.3% year over year from $4,338.3 million.
Outlook
According to Nucor, the company expects generally stable and improving market conditions for automotive, energy, nonresidential construction, agriculture and heavy equipment. It is also encouraged by the cumulative benefits resulting from successful trade cases of the domestic steel industry. The company expects earnings in fourth-quarter 2017 to be to be similar to slightly lower from the third quarter, excluding tax benefits recognized during the third quarter of 2017.
Nucor expects improved performance from the raw materials unit on the back of more consistent DRI production. Its downstream steel products unit is also expected to benefit from margin improvement whereas the steel mills unit is expected to witness some decline mainly due to weakness in plate steel and typical seasonality.
How Have Estimates Been Moving Since Then?
It turns out, fresh estimates have trended downward during the past month. There have been three revisions lower for the current quarter. In the past month, the consensus estimate has shifted lower by 14.8% due to these changes.
Nucor Corporation Price and Consensus
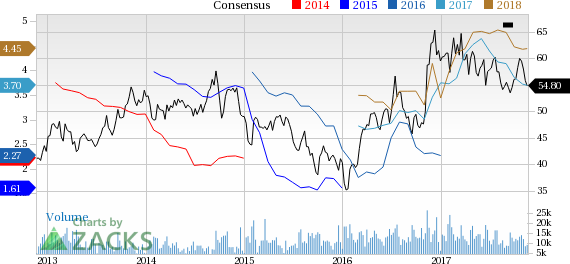
Nucor Corporation Price and Consensus | Nucor Corporation Quote
VGM Scores
Currently, Nucor's stock has a poor Growth Score of F, though it is doing a bit better on the momentum front with a D. The stock was allocated a grade of B on the value side, putting it in the top 40% for this investment strategy.
Overall, the stock has an aggregate VGM Score of D. If you aren't focused on one strategy, this score is the one you should be interested in.
The company's stock is suitable solely for value investors based on our style scores.
Outlook
Estimates have been broadly trending downward for the stock. The magnitude of this revision also indicates a downward shift. Notably, the stock has a Zacks Rank #3 (Hold). We expect in-line returns from the stock in the next few months.
These stocks provide a compelling case as safe-haven stocks in the face of an escalating trade war. Each company operates within sectors that are relatively resilient to economic...
When the market narrative becomes too widely accepted, excess seems to be created in some areas of the economy as businesses prepare for what’s coming their way. Today’s stock...
Markets are bouncing back as investors bet on technical support, tariff relief, and Germany’s stimulus plans. But with ISM and NFP data ahead, Fed rate cut bets could shift,...
Are you sure you want to block %USER_NAME%?
By doing so, you and %USER_NAME% will not be able to see any of each other's Investing.com's posts.
%USER_NAME% was successfully added to your Block List
Since you’ve just unblocked this person, you must wait 48 hours before renewing the block.
I feel that this comment is:
Thank You!
Your report has been sent to our moderators for review
Add a Comment
We encourage you to use comments to engage with other users, share your perspective and ask questions of authors and each other. However, in order to maintain the high level of discourse we’ve all come to value and expect, please keep the following criteria in mind:
Enrich the conversation, don’t trash it.
Stay focused and on track. Only post material that’s relevant to the topic being discussed.
Be respectful. Even negative opinions can be framed positively and diplomatically. Avoid profanity, slander or personal attacks directed at an author or another user. Racism, sexism and other forms of discrimination will not be tolerated.
Perpetrators of spam or abuse will be deleted from the site and prohibited from future registration at Investing.com’s discretion.