


Sign up to create alerts for Instruments,
Economic Events and content by followed authors
Free Sign Up Already have an account? Sign In
Please try another search

It has been about a month since the last earnings report for Meritor, Inc. (NYSE:MTOR) . Shares have lost about 18.6% in the past month, underperforming the market.
Will the recent negative trend continue leading up to its next earnings release, or is MTOR due for a breakout? Before we dive into how investors and analysts have reacted as of late, let's take a quick look at its most recent earnings report in order to get a better handle on the important catalysts.
Meritor Q1 Earnings & Revenues Surpass Estimates
Meritor recorded adjusted earnings of 62 cents per share in first-quarter fiscal 2018 (ended Dec 31, 2017), comfortably surpassing the Zacks Consensus Estimate of 46 cents. The year-ago figure was 25 cents per share.
Adjusted income from continuing operations was $55 million compared with $22 million in the first quarter of fiscal 2017.
Revenues increased 29% year over year to $903 million. The top line also beat the Zacks Consensus Estimate of $826.3 million.
Meritor’s adjusted EBITDA (earnings before interest, tax, depreciation and amortization) increased to $99 million from $64 million a year ago. Adjusted EBITDA margin was 11% compared with 9.2% in the comparable quarter last year. Both adjusted EBITDA and EBITDA margin increased on a year-over-year basis, driven by high revenue growth and a positive impact of changes in the company's retiree medical benefits.
Segment Results
Revenues from the Commercial Truck & Industrial segment shot up to $738 million, up $199 million from the same period last year. This upside was primarily driven by higher production across all regions with North America witnessing the highest gain. Segment adjusted EBITDA jumped to $80 million, up $38 million from the year-ago quarter. EBITDA margin rose to 10.8% in comparison to 7.8% in the prior-year quarter.
Revenues from the Aftermarket & Trailer segment were $195 million, up $11 million from the year-ago quarter, primarily on higher volumes across all segments. Segment EBITDA was $21 million compared with $22 million from the same time frame a year ago. EBITDA margin decreased to 10.8% in comparison to 12% in the preceding year. This reduction in Segment EBITDA and EBITDA margin was due to incremental investments as part of revenue growth initiatives.
Financial Position
Meritor’s cash and cash equivalents totaled $116 million as of Dec 31, 2017 compared with $88 million as of Sep 30, 2017. Long-term debt climbed to $751 million as of Dec 31, 2017 from $750 million as of Sep 30, 2017.
At the end of first-quarter fiscal 2018, Meritor’s cash flow from operating activities was $33 million compared with the cash flow of $14 million used for operating activities in the same period a year ago. Capital expenditures increased to $18 million from the year-ago figure of $17 million.
Outlook
For fiscal 2018, Meritor expects revenues within the band of $3.8-$3.9 billion compared with the previous expectation of approximately $3.6 billion. Adjusted earnings from continuing operations are anticipated in the range of $2.5-$2.7 per share compared with the past projection of $2.2-$2.4. Adjusted EBITDA margin is forecast within 11-11.2% as compared to the prior prediction of 10.8-11%.
Further, the company estimates its free cash flow for fiscal 2018 within the range of $110-$125 million, an increase from the preceding guidance of $90-$100 million. Similarly, operating cash flow is likely to be in the band of $210-$225 million, a rise from the previous view of $190-$200 million.
How Have Estimates Been Moving Since Then?
In the past month, investors have witnessed an upward trend in fresh estimates. There have been three revisions higher for the current quarter.
VGM Scores
At this time, MTOR has a great Growth Score of A, a grade with the same score on the momentum front. Charting a somewhat similar path, the stock was also allocated a grade of B on the value side, putting it in the top 40% for this investment strategy.
Overall, the stock has an aggregate VGM Score of A. If you aren't focused on one strategy, this score is the one you should be interested in.
Based on our scores, the stock is equally suitable for growth and momentum investors while value investors may want to look elsewhere.
Outlook
Estimates have been trending upward for the stock and the magnitude of these revisions looks promising. It comes with little surprise MTOR has a Zacks Rank #2 (Buy). We expect an above average return from the stock in the next few months.
Shares of Caesars Entertainment (NASDAQ:CZR), a leading gambling stock, traded around 3% higher on Wednesday morning, though the stock was trading around 1.5% lower shortly before...
Amazon (NASDAQ:AMZN) is making a significant push into the future with a robust investment in robotics and artificial intelligence. The company has earmarked $35 billion for...
Home Depot’s (NYSE:HD) Q4 2024 report and guidance for 2025 have plenty to be unhappy about, but the simple truth is that this company turned a corner in 2024. It is on track for...
Are you sure you want to block %USER_NAME%?
By doing so, you and %USER_NAME% will not be able to see any of each other's Investing.com's posts.
%USER_NAME% was successfully added to your Block List
Since you’ve just unblocked this person, you must wait 48 hours before renewing the block.
I feel that this comment is:
Thank You!
Your report has been sent to our moderators for review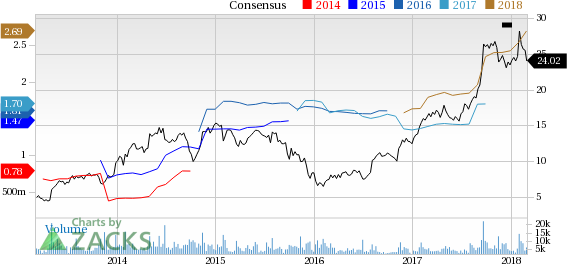

Add a Comment
We encourage you to use comments to engage with other users, share your perspective and ask questions of authors and each other. However, in order to maintain the high level of discourse we’ve all come to value and expect, please keep the following criteria in mind:
Enrich the conversation, don’t trash it.
Stay focused and on track. Only post material that’s relevant to the topic being discussed.
Be respectful. Even negative opinions can be framed positively and diplomatically. Avoid profanity, slander or personal attacks directed at an author or another user. Racism, sexism and other forms of discrimination will not be tolerated.
Perpetrators of spam or abuse will be deleted from the site and prohibited from future registration at Investing.com’s discretion.