


Sign up to create alerts for Instruments,
Economic Events and content by followed authors
Free Sign Up Already have an account? Sign In
Please try another search

It has been about a month since the last earnings report for Illinois Tool Works Inc. (NYSE:ITW) . Shares have added about 2.6% in that time frame, outperforming the market.
Will the recent positive trend continue leading up to the stock's next earnings release, or is it due for a pullback? Before we dive into how investors and analysts have reacted of late, let's take a quick look at its most recent earnings report in order to get a better handle on the important catalysts.
Third-Quarter 2017 Highlights
Illinois Tool Works reported impressive results for third-quarter 2017, pulling off a positive earnings surprise of 3.64%. Results were primarily driven by sales growth, benefits from enterprise initiatives and 2.7% fall in the diluted share count due to the company's active share buyback activities.
Earnings in the quarter came in at $1.71 per share, above the Zacks Consensus Estimate of $1.65 and roughly 14% above the year-ago tally of $1.50. As noted, the bottom-line results excluded roughly 14 cents benefit accrued from a legal settlement.
Organic and Forex Gains Drove Top-Line Results
The quarter's revenues totaled $3,615 million, reflecting growth of 4% from the year-ago tally. The improvement was driven by 2% organic gains and 2% positive impact of foreign currency movements.
Also, the top-line result surpassed the Zacks Consensus Estimate of $3.58 billion.
Illinois Tool Works reports its revenues under the segments discussed below:
Test & Measurement and Electronics' revenues increased 1.8% year over year to $525 million. Revenues from Automotive OEM (Original Equipment Manufacturer) grew 4.1% to $795 million. Food Equipment generated revenues of $549 million, increasing 1.1% year over year.
Welding revenues came in at $378 million, growing 4.8% year over year. Construction Products' revenues were up 6% to $440 million while revenues of $498 million from Specialty Products reflected growth of 4.6%. Polymers & Fluids' revenues of $434 million increased 2.6% year over year.
Margin Profile Improves
In the quarter, Illinois Tool Works' cost of sales increased 3.3% year over year, representing 57.9% of total revenues compared with 58% in the year-ago quarter. Selling, administrative, and research and development expenses, as a percentage of total revenues, came in at 16.3%.
Operating margin improved 130 bps year over year to 24.4%, driven by roughly 110 bps contributions from enterprise initiatives. The margin excluded the impact from the legal settlement.
Cash Position Strong, Debt Increases
Exiting the third quarter, Illinois Tool Works had cash and cash equivalents of approximately $2,785 million, up from $2,496 million recorded in the previous quarter. Also, the company generated net cash of $780 million from its operating activities in the quarter, up 25% year over year. Capital expenditure on purchase of plant and equipment totaled $78 million. Adjusted free cash flow was $702 million, reflecting a conversion rate (as a percentage of net income) of 110%.
The company's long-term debt balance increased 1.1% sequentially to $7,439 million.
Outlook: Illinois Tool Works increased its GAAP earnings guidance to $6.62-$6.72 per share, reflecting 25 cents growth at mid-point.
Organic revenue growth is expected to be 2-3% while operating margin is projected to be 24.5%. Full-year free cash flow is anticipated to be in excess of 100% of net income.
For fourth-quarter 2017, GAAP earnings per share are expected within $1.55-$1.65. Organic revenues are expected to be 2-3%.
How Have Estimates Been Moving Since Then?
Following the release, investors have witnessed an upward trend in fresh estimates. There have been two revisions higher for the current quarter. While looking back an additional 30 days, we can see even more upward momentum. There have been seven five moves up in the last two months.
Illinois Tool Works Inc. Price and Consensus
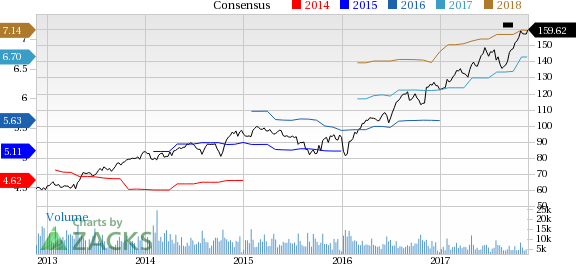
Illinois Tool Works Inc. Price and Consensus | Illinois Tool Works Inc. Quote
VGM Scores
At this time, Illinois Tool Works' stock has a nice Growth Score of B, however its Momentum is doing a bit better with an A. However, the stock was allocated a grade of D on the value side, putting it in the bottom 40% for this investment strategy.
Overall, the stock has an aggregate VGM Score of C. If you aren't focused on one strategy, this score is the one you should be interested in.
Our style scores indicate that the stock is more suitable for momentum investors than growth investors.
Outlook
Estimates have been trending upward for the stock. The magnitude of these revisions also looks promising. Notably, the stock has a Zacks Rank #3 (Hold). We expect in-line returns from the stock in the next few months.
When looking for dividend stocks, high dividend yields are one important factor to consider. Even if a company’s dividend yield isn’t nearing double-digit percentages, finding...
Whenever Wall Street authoritative figures, such as a large institution or individual investor, decide to shift a view on a specific stock or industry, retail traders can...
Monster Beverage (NASDAQ:MNST) faces headwinds that make it a potentially scary buy, including weakness in the alcohol segment. With the alcohol business contracting in Q4 2024,...
Are you sure you want to block %USER_NAME%?
By doing so, you and %USER_NAME% will not be able to see any of each other's Investing.com's posts.
%USER_NAME% was successfully added to your Block List
Since you’ve just unblocked this person, you must wait 48 hours before renewing the block.
I feel that this comment is:
Thank You!
Your report has been sent to our moderators for review
Add a Comment
We encourage you to use comments to engage with other users, share your perspective and ask questions of authors and each other. However, in order to maintain the high level of discourse we’ve all come to value and expect, please keep the following criteria in mind:
Enrich the conversation, don’t trash it.
Stay focused and on track. Only post material that’s relevant to the topic being discussed.
Be respectful. Even negative opinions can be framed positively and diplomatically. Avoid profanity, slander or personal attacks directed at an author or another user. Racism, sexism and other forms of discrimination will not be tolerated.
Perpetrators of spam or abuse will be deleted from the site and prohibited from future registration at Investing.com’s discretion.