


Sign up to create alerts for Instruments,
Economic Events and content by followed authors
Free Sign Up Already have an account? Sign In
Please try another search

A month has gone by since the last earnings report for Centene Corporation (NYSE:CNC) . Shares have lost about 2.6% in that time frame.
Will the recent negative trend continue leading up to its next earnings release, or is CNC due for a breakout? Before we dive into how investors and analysts have reacted as of late, let's take a quick look at its most recent earnings report in order to get a better handle on the important drivers.
Centene Beats Q4 Earnings & Revenues, Ups ’18 View
Centene reported fourth-quarter 2017 adjusted net income per share of 97 cents, which beat the Zacks Consensus Estimate by 3.2%. Earnings, however, declined 18% year over year on higher expenses.
For the fourth quarter, total revenues grew 8% to $12.8 billion from the year-ago quarter, primarily driven by growth in the Health Insurance Marketplace business in 2017 and expansions and new programs in many states in 2016 and 2017. Revenues surpassed the Zacks Consensus Estimate of $12.3 billion by 4%.
Full-Year Update
For 2017, the company reported adjusted earnings of $5.03, up 13.5% year over year. The figure also surpassed the Zacks Consensus Estimate by 0.8%
Centene reported total revenues of $48.4 billion, up 19% year over year. The rise was primarily driven by Health Net's results throughout the year, impact of growth in the Health Insurance Marketplace business in 2017 and expansions and new programs in many states in 2016 and 2017.
At the end of the year, managed care membership totaled 12.2 million, up 7% from 2016.
Quarterly Operational Update
Health Benefit Ratio (HBR) for the fourth quarter was 87.3% compared with 84.8% in the prior-year quarter. This reflects a year-over-year improvement of 250 basis points (bps).
In the quarter, adjusted SG&A ratio was 10.5%, up 110 bps year over year. The deterioration is a result of increased business expansion costs over the prior-year quarter. Notably, revenues recognized in the fourth quarter of 2016, relating to the minimum MLR amendment in California, had reduced the quarter’s adjusted selling, general & administrative (SG&A) expense ratio. Hence, the expense ratio for the fourth-quarter 2017 appears higher compared to the year-ago quarter.
Total operating expenses of $12.6 billion at the end of fourth quarter increased nearly 11% from the prior-year quarter.
Financial Update
As of Dec 31, 2017, Centene had cash and cash equivalents of $4 billion, up 3.6% from 2016 end.
Total assets of $21.8 billion grew 8.2%.
As of Dec 31, 2017, Centene’s long-term debt totaled $4.7 billion, up 0.9%.
For 2017, cash inflow from operations was $1,489 million compared with $1,851 million at the end of 2016.
2018 Guidance
Centene expects adjusted earnings per share to be in the range of $6.95-$7.35, up from the previously guided range of $5.47-$5.87.
Total revenues are expected to be in the range of $60.6-$61.4 billion, up from the earlier guidance of $60.0 billion to $60.8 billion.
HBR is expected in the range of 86.2-86.7% compared with the previous guidance of 86.3% to 86.8%.
Adjusted SG&A expense ratio is expected in the range of 9.2-9.7%, up from the previous guidance of 9.0% to 9.5%.
Shares outstanding is expected be between 199.1 million and 200.1 million, down from the previous guidance of 201.1 million to 202.1 million.
How Have Estimates Been Moving Since Then?
In the past month, investors have witnessed an upward trend in fresh estimates.
Centene Corporation Price and Consensus
VGM Scores
At this time, CNC has a nice Growth Score of B, a grade with the same score on the momentum front. Charting a somewhat similar path, the stock was allocated a grade of A on the value side, putting it in the top 20% for this investment strategy.
Overall, the stocks has an aggregate VGM Score of A. If you aren't focused on one strategy, this score is the one you should be interested in.
Based on our scores, the stock is more suitable for value investors than those looking for growth and momentum.
Outlook
Estimates have been trending upward for the stock and the magnitude of these revisions looks promising. It comes with little surprise CNC has a Zacks Rank #1 (Strong Buy). We expect an above average return from the stock in the next few months.
Since the Robotaxi event on October 11th, Tesla (NASDAQ:TSLA) stock is up 38%, currently priced at $291.60 per share This is a return to the early November 2024 price level. But...
The Q4 2024 earnings season tapers off from here, with S&P 500® EPS growth surpassing 17%, the highest in 3 years Large cap outlier earnings dates this week include:...
Shares of Alibaba (NYSE:BABA) are on a tear to start off 2025. The consumer discretionary and tech stock is up by 52% this year as of the Feb. 25 close. The company’s cloud...
Are you sure you want to block %USER_NAME%?
By doing so, you and %USER_NAME% will not be able to see any of each other's Investing.com's posts.
%USER_NAME% was successfully added to your Block List
Since you’ve just unblocked this person, you must wait 48 hours before renewing the block.
I feel that this comment is:
Thank You!
Your report has been sent to our moderators for review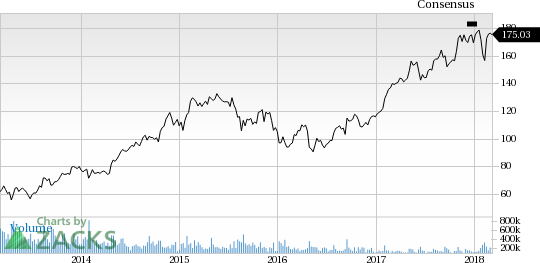

Add a Comment
We encourage you to use comments to engage with other users, share your perspective and ask questions of authors and each other. However, in order to maintain the high level of discourse we’ve all come to value and expect, please keep the following criteria in mind:
Enrich the conversation, don’t trash it.
Stay focused and on track. Only post material that’s relevant to the topic being discussed.
Be respectful. Even negative opinions can be framed positively and diplomatically. Avoid profanity, slander or personal attacks directed at an author or another user. Racism, sexism and other forms of discrimination will not be tolerated.
Perpetrators of spam or abuse will be deleted from the site and prohibited from future registration at Investing.com’s discretion.