


Sign up to create alerts for Instruments,
Economic Events and content by followed authors
Free Sign Up Already have an account? Sign In
Please try another search

Science Applications International Corporation (NYSE:SAIC) is set to report fourth-quarter fiscal 2020 results on Mar 26.
The company’s earnings surpassed the Zacks Consensus Estimate in three of the last four quarters and missed in the other, the average positive surprise being 11.7%.
In the last reported quarter, the company delivered earnings of $1.39 per share, missing the Zacks Consensus Estimate of $1.44. However, the bottom-line figure improved nearly 3% year over year. Moreover, revenues jumped 38% from the year-ago quarter to $1.6 billion but lagged the Zacks Consensus Estimate of $1.63 billion.
Science Applications International Corporation Price and Consensus
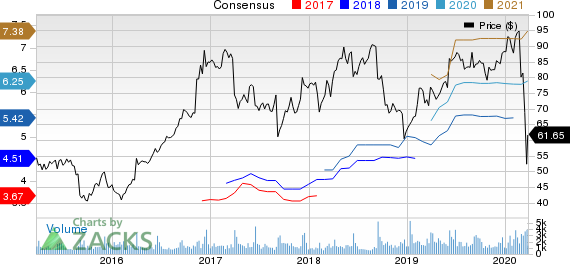
Science Applications International Corporation price-consensus-chart | Science Applications International Corporation Quote
The Zacks Consensus Estimate for fiscal fourth-quarter revenues is pegged at $1.57 billion, indicating approximately 32% improvement from the year-ago reported figure. For earnings, the consensus estimate stands at $1.32, suggesting 12.8% year-over-year growth.
Let’s see how things are shaping up prior to this announcement.
Factors to Consider
Science Applications’ fiscal fourth-quarter performance is likely to have benefited from its strong product portfolio, which is aiding contract wins. The company’s capability to sustain its existing contracts, coupled with the newly-awarded ones across the customer portfolio, is likely to have been a steady tailwind.
Moreover, the integration of the Engility buyout might have driven the company’s top and bottom lines. In the last reported quarter, excluding Engility, revenues dipped 1.5%, year on year.
The acquisition of Engility is also likely to have boosted the company’s margin profile and cash flow.
Nonetheless, revenue dis-synergies due to the elimination of prime sub-duplicate revenues might have had a slight negative impact. Further, higher interest expenses are likely to have dampened the bottom line.
Furthermore, investors should be more focused on the company’s guidance rather than the quarterly results. Science Applications’ guidance for fiscal 2021 will give a proper insight about the company’s plans to combat the coronavirus crisis and stay afloat.
What Our Model Says
Our proven model does not predict an earnings beat for Science Applications this season. The combination of a positive Earnings ESP, and Zacks Rank #1 (Strong Buy), 2 (Buy) or 3 (Hold) increases the chances of an earnings beat. But that’s not the case here. You can uncover the best stocks to buy or sell, before they’re reported, with our Earnings ESP Filter.
Science Applications currently carries a Zacks Rank of 2 and has an Earnings ESP of -0.51%.
Stocks to Consider
Here are some companies, which, per our model, have the right combination of elements to post an earnings beat in their soon to be reported quarterly results:
FactSet Research Systems Inc. (NYSE:FDS) has an Earnings ESP of +0.77% and carries a Zacks Rank of 2, at present. You can see the complete list of today’s Zacks #1 Rank stocks here.
Ascendis Pharma A/S (NASDAQ:ASND) has an Earnings ESP of +3.15% and carries a Zacks Rank of 3, at present.
Lululemon Athletica Inc. (NASDAQ:LULU) has an Earnings ESP of +0.42% and currently carries a Zacks Rank of 3.
Looking for Stocks with Skyrocketing Upside?
Zacks has just released a Special Report on the booming investment opportunities of legal marijuana.
Ignited by new referendums and legislation, this industry is expected to blast from an already robust $6.7 billion to $20.2 billion in 2021. Early investors stand to make a killing, but you have to be ready to act and know just where to look.
See the pot trades we're targeting>>
Home Depot’s (NYSE:HD) Q4 2024 report and guidance for 2025 have plenty to be unhappy about, but the simple truth is that this company turned a corner in 2024. It is on track for...
Nvidia is scheduled to release its Q4 earnings report at 4:20PM ET on Wednesday. A call with CEO Jensen Huang is set for 5:00PM ET. The chipmaker’s results will serve as a...
Warren Buffett has always critiqued airline stocks for being overly capital-intensive, exhibiting low growth, and relying heavily on cyclical consumer travel patterns—further...
Are you sure you want to block %USER_NAME%?
By doing so, you and %USER_NAME% will not be able to see any of each other's Investing.com's posts.
%USER_NAME% was successfully added to your Block List
Since you’ve just unblocked this person, you must wait 48 hours before renewing the block.
I feel that this comment is:
Thank You!
Your report has been sent to our moderators for review
Add a Comment
We encourage you to use comments to engage with other users, share your perspective and ask questions of authors and each other. However, in order to maintain the high level of discourse we’ve all come to value and expect, please keep the following criteria in mind:
Enrich the conversation, don’t trash it.
Stay focused and on track. Only post material that’s relevant to the topic being discussed.
Be respectful. Even negative opinions can be framed positively and diplomatically. Avoid profanity, slander or personal attacks directed at an author or another user. Racism, sexism and other forms of discrimination will not be tolerated.
Perpetrators of spam or abuse will be deleted from the site and prohibited from future registration at Investing.com’s discretion.