
- All Instrument Types
- Indices
- Equities
- ETFs
- Funds
- Commodities
- Currencies
- Crypto
- Bonds
- Certificates
Please try another search

Week Ahead: Sentiment Swings To Continue Driving Stocks; Gold Set To Break Out

- Investors are banking on a quick economic recovery
- Markets continue paying attention to good news while ignoring bad news
- Analysis unclear whether we're currently in a bull or bear market
After a volatile week, during which markets wavered daily between risk-on and risk-off, US equities finished the trading week at their highest point since the week ending March 6.
Investor sentiment flip-flopped equally between optimism because of a reopening economy, versus pessimism as confirmed COVID-19 cases globally shot past 5 million and the US death toll closes in on 100,000. Adding to defensive concerns: the resurgence of US-China trade tensions.
Oil climbed for the fourth straight week and the dollar gained.
Economic Recovery Already Priced In
For the S&P 500, the past week was its best in a month. The benchmark added 3.2% to its rally with all sectors except Healthcare, (-0.8%), in the green. Industrials, (+7.4%), and Energy, (+6.9%), outperformed.
The benchmark index closed up 32.1% from the March 23 bottom, the result of three primary drivers: (1) anticipation of a coronavirus vaccine (2) hopes that a restarted economy would lead to growth recovery and (3) unprecedented government stimulus. All of which overshadowed the brewing trade tiff and devastating economic data, including the worst jobs market since the Great Depression—last week's initial claims release brought the number of Americans filing for jobless benefits to almost 40 million.
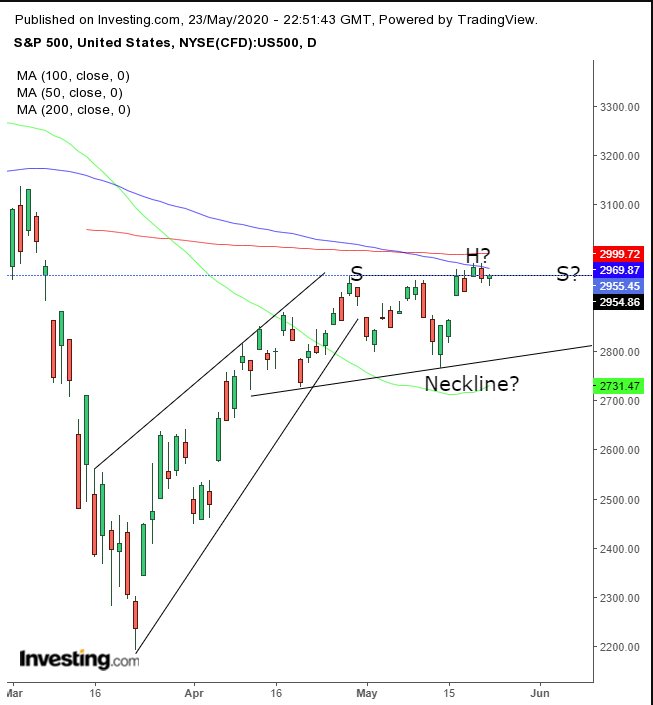
On May 20 the SPX made a new high, dispelling the possibility of a double-top, after blowing a potential H&S top. However, that doesn’t mean that the market can’t form a larger top, using the original neckline. Tops generally take months to develop.
The question is whether a roaring rally amid so much uncertainty, supported by little more than hope, is a recipe for future investor satisfaction or a potential market conflagration. Still, it appears the equity market is willing to tolerate bad news, and indeed, repeatedly move past it.
Market pricing is determined by investor outlook and it’s becoming exceedingly clear that investors have already moved past the devastating economic data and are already pricing in the expected recovery. So at what point has the market priced in a recovery? And when, if traders don't see one, will they turn bearish and start to stampede in the other direction?
The current chatter says the market expects the recovery to become apparent during the second half of the year and into 2021 as a vaccine and potential treatments for COVID-19 help significantly lower, and eventually obliterate, the number of reported cases and fatalities worldwide, all of which will of course speed progress on reopening the economy even further.
However, we don’t know any of this for sure. It's purely market speculation. Indeed, it's doubtful anyone knows.
So, Are We In A Bear Or Bull Market?
One metric, the 20% upside move since the March low, puts us in a bull market right now.
But another, traditional Wall Street definition suggests it's still a bear market, at least until stocks make new highs above the previous, February peak. An additional indicator for a new bull market would have been a change in sector leadership. So far, the same big tech stocks that led equities to new records prior to the pandemic continue piloting this rally.
As for investors, 68% of those who participated in Bank of America’s monthly global fund manager survey consider the current rebound to be a bear market rally. The bank's chief investment strategist, Michael Hartnett, said the rally is “divorced from reality,” referring to it as “fake markets.”
Bottom line: we're not sure what to call this. It's either the strongest “bear-market rally” in the last 75 years and the sharpest two-month gain for the S&P 500 since before 1991, or it's a new bull market. We'll not second guess what's going on right now, but rather will attempt to take this one leg at a time.
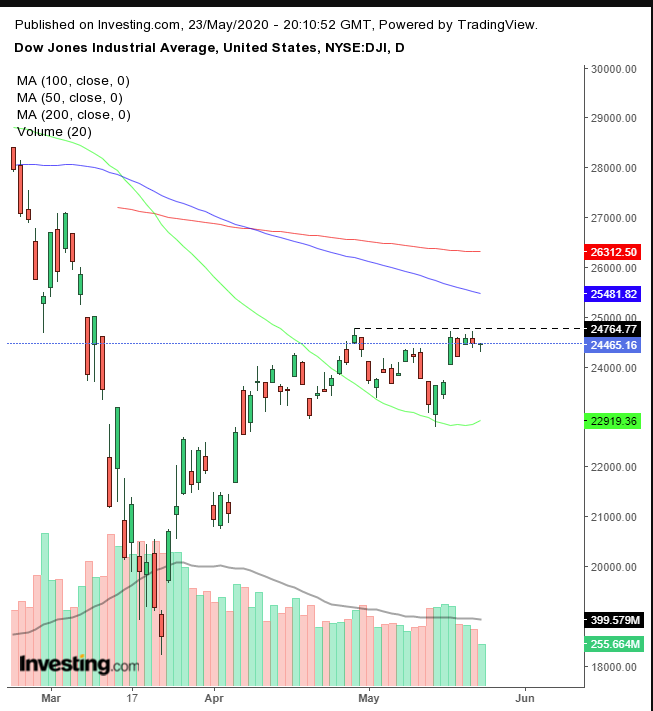
Additionally noteworthy: the Dow Jones hasn't made a new high since April 29.
Moreover, even as the mega cap index has been rallying, volume has been diminishing, putting a question mark on the viability of its upward trajectory.
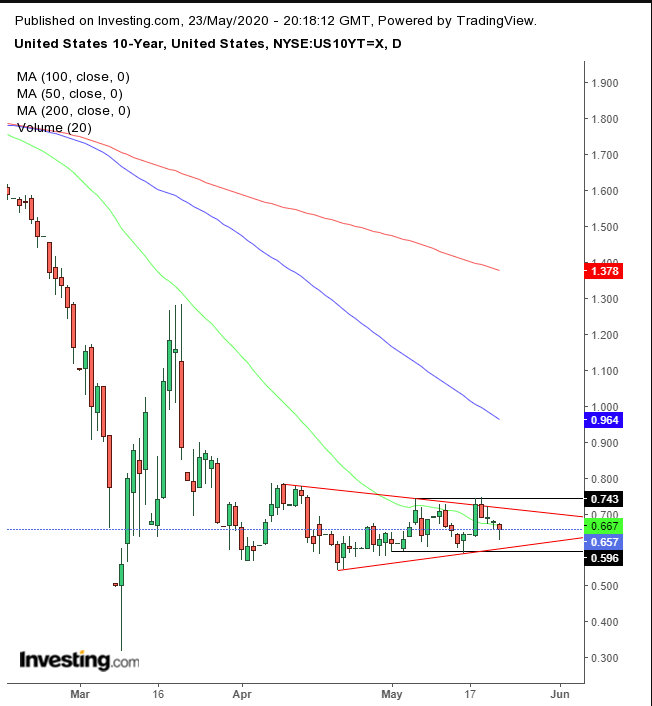
Yields, including for the 10-year Treasury note, have moved sideways in May, keeping them flat for the month.
However, they've been converging if viewed since early April. Are rates at equilibrium, or have central banks simply fixed government and corporate bond prices, as Bank of America’s Hartnett maintains, above?
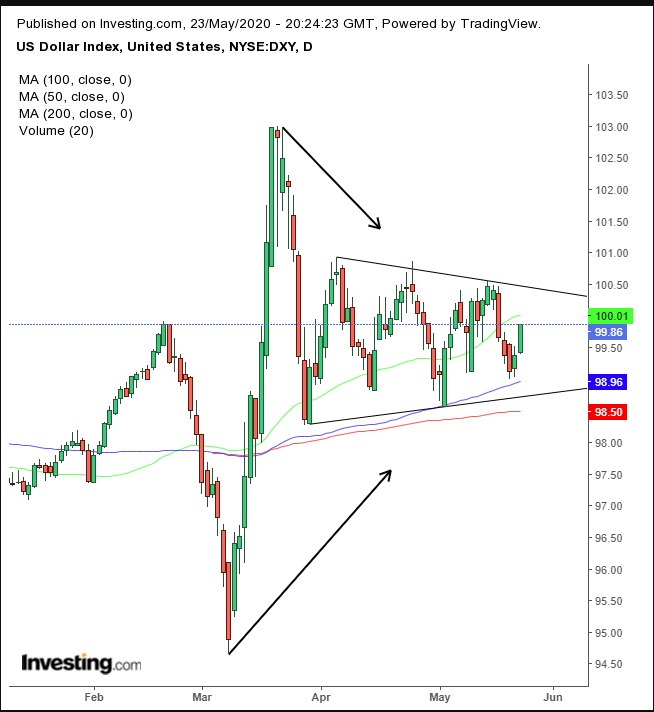
The dollar jumped on Friday, for a second day of gains.
The USD bounced off the 100 DMA, which has been guarding the bottom of a symmetrical triangle whose up-and-down preceding move gives no clue as to the direction of the next breakout.
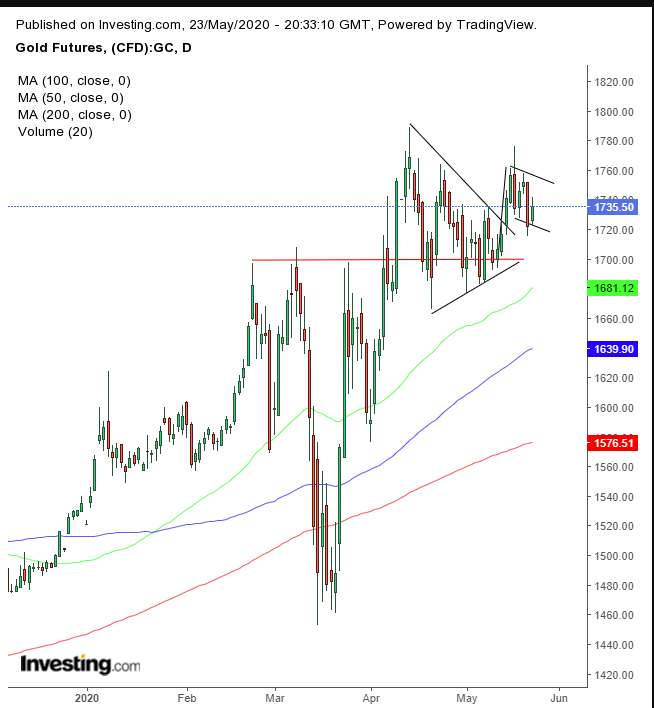
Uncharacteristically, gold advanced on Friday, even as the dollar and equities also gained.
From a technical perspective, the precious metal rebounded at the bottom of a falling flag, bullish following the preceding jump—which is itself an upside breakout of a larger bullish pattern, a symmetrical triangle. Adding to the power of the move, it is an additional, larger upside breakout of a H&S continuation pattern.
In total, three back-to-back bullish patterns, each individually promising a continued rally. The hat trick makes the case for a powerful surge. Does this negate the case for a continued equity rally, or diminish the chance of an upside breakout for the greenback? Hard to say. Perhaps everything will rise in unison as happened after Donald Trump took the White House. Of course, there's always the chance we’ll witness a colossal failure to the triple bullish pattern.
While Bitcoin's pennant failed, it remained above the bottom of a rising channel since the March lows for three sessions.
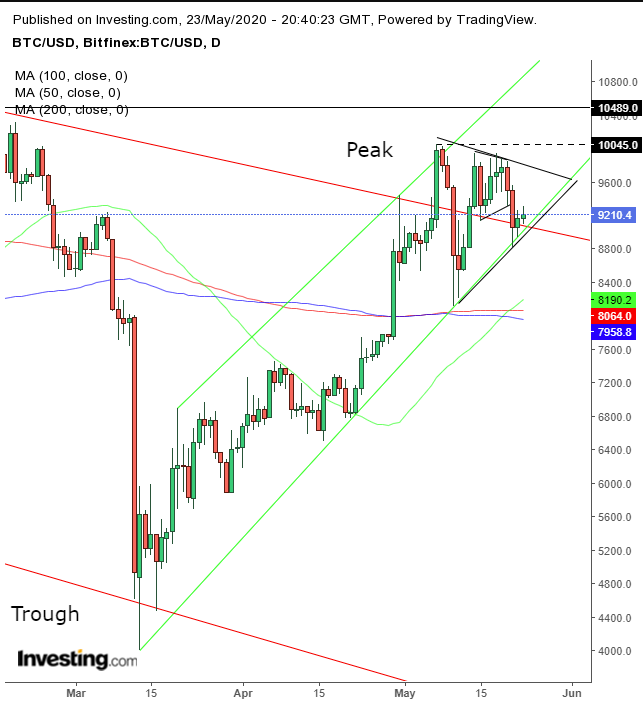
That confirms the support and also makes the case for a larger pennant. An upside breakout would signal a resumption of the uptrend.
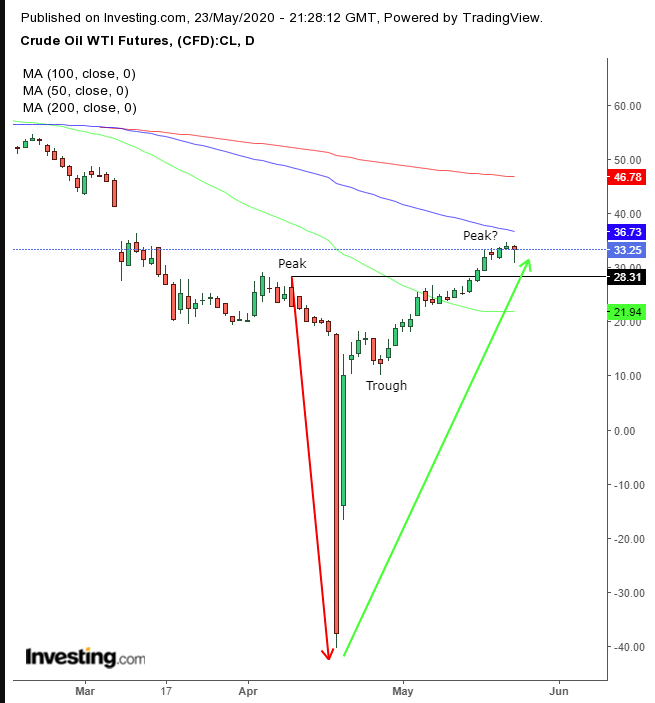
Oil rallied for a sixth day on Friday.
Technically we're flummoxed. The price may have formed a text-book, V-shaped bottom. On the other hand, that would include negative pricing, something the developers of technical analysis couldn’t have taken into account. Ergo, we have no previous experience of this phenomenon nor any statistics to draw on. Cautious investors would probably wait for a pullback, then for the commodity to make higher highs, to establish a peak-and-trough uptrend.
Week Ahead
All times listed are EDT
Monday
US and UK markets closed for Memorial Day and Bank Holidays respectively.
2:00: Germany – GDP: seen to remain flat at -2.2%.
4:00: Germany – Ifo Business Climate: expected to rise to 78.3 from 74.3.
Tuesday
10:00: US – New Home Sales: probably fell to 490K from 627K.
Thursday
8:30: US – Core Durable Goods Orders: anticipated to plunge to -14.0% from -0.6%.
8:30: US – GDP: forecast to remain flat at -4.8%.
8:30: US – Initial Jobless Claims: predicted to come in at 2,000K after last week's 2,438K.
10:00: US – Pending Home Sales: seen to rise to -15.0% from -20.8%.
11:00: US – Crude Oil Inventories: last week's EIA release showed a drawdown of 4.983m bbl.
Friday
5:00: Eurozone – CPI: likely to drop to 0.1% from 0.3%.
8:30: Canada – GDP: forecast to plummet to -9.0% from 0.0%.
Saturday
21:00: China – Manufacturing PMI: expected to edge higher to 51.0 from 50.8.
Related Articles

MON: Eurogroup Meeting, Norwegian CPI (Feb), EZ Sentix Index (Mar), Japanese GDP (Q4) TUE: EIA STEO WED: 25% US tariff on all imports of steel and aluminium comes into effect,...

Brief Reminder In 2018, US President Donald Trump initiated a trade war update with sanctions against China. Economic disagreement between the United States and China began in...

Trump’s U-Turns Keep the Market Under Pressure Both US equity indices and the US dollar remain under severe stress as US President Trump continues his back-and-forth on the...
Are you sure you want to block %USER_NAME%?
By doing so, you and %USER_NAME% will not be able to see any of each other's Investing.com's posts.
%USER_NAME% was successfully added to your Block List
Since you’ve just unblocked this person, you must wait 48 hours before renewing the block.
I feel that this comment is:
Thank You!
Your report has been sent to our moderators for review



Add a Comment
We encourage you to use comments to engage with other users, share your perspective and ask questions of authors and each other. However, in order to maintain the high level of discourse we’ve all come to value and expect, please keep the following criteria in mind:
Enrich the conversation, don’t trash it.
Stay focused and on track. Only post material that’s relevant to the topic being discussed.
Be respectful. Even negative opinions can be framed positively and diplomatically. Avoid profanity, slander or personal attacks directed at an author or another user. Racism, sexism and other forms of discrimination will not be tolerated.
Perpetrators of spam or abuse will be deleted from the site and prohibited from future registration at Investing.com’s discretion.