


Sign up to create alerts for Instruments,
Economic Events and content by followed authors
Free Sign Up Already have an account? Sign In
Please try another search

VIVUS Inc. (NASDAQ:VVUS) reported a loss of 6 cents per share in the third quarter of 2017, which was narrower than a loss of 9 cents in the year-ago period and the Zacks Consensus Estimate of 13 cents.
Quarterly revenues increased 13.8% from the year-ago period to $15.2 million.
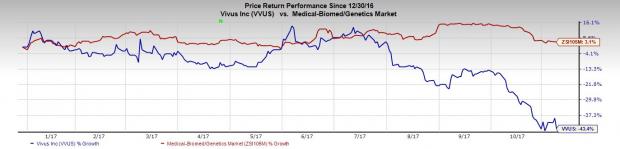
Shares of the biotech company however fell more than 7.8% on Thursday on lower Qsymia sales. In fact, so far this year, VIVUS shares have underperformed the industry. The stock declined 43.4% during the period, while the industry witnessed a gain of 3.1%.
Quarter in Detail
The company’s weight management drug Qsymia generated net product sales of $9.9 million, down 19.4% from the year-ago period due to reduction in Qsymia inventory by wholesalers and unfavorable impact of change in revenue recognition methodology.
Supply and royalty revenues from Stendra/Spedra were $4.6 million in this quarter. The company had recorded no such revenues in the year-ago period.
Selling, general and administrative expense was $8.4 million, down 19.6% year over year, mainly attributable to cost control initiatives undertaken by the company. Research and development expense decreased almost 47.1% to $0.9 million in the reported quarter due to decrease efforts related to Qsymia regulatory requirements, partially offset by development of tacrolimus for the treatment of pulmonary arterial hypertension (PAH).
During the quarter, VIVUS entered into settlement agreements with subsidiaries of Teva Pharmaceutical Industries Limited (NYSE:TEVA) and Dr. Reddy's Laboratories Limited (NYSE:RDY) related to the launch of generic versions of Qsymia. Per the agreements, Actavis (NYSE:AGN) (“Teva”) and Dr. Reddy's are authorized to sell a generic version of Qsymia from Dec 1, 2024 and Jun 1, 2025, respectively.
Moreover, the company signed an agreement with South Korea based Alvogen Malta Operations (ROW) Ltd granting marketing rights for Qsymia in the Republic of Korea for an upfront payment, milestone payments and royalties on sales.
VIVUS’ lead pipeline candidate, tacrolimus, was granted orphan designation by the European Medicines Agency for PAH indication. The company is on track to file an investigational new drug application for the candidate in the United States in the first half of 2018.
VIVUS, Inc. Price, Consensus and EPS Surprise
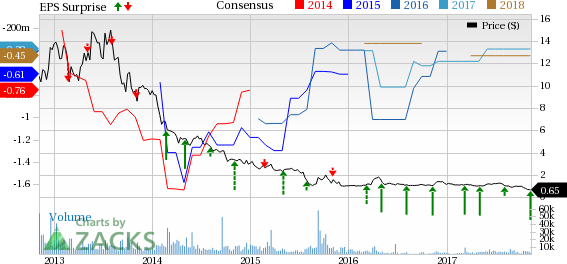
VIVUS, Inc. Price, Consensus and EPS Surprise | VIVUS, Inc. Quote
Zacks Rank & Stock to Consider
VIVUS carries a Zacks Rank #3 (Hold). A better-ranked stock in the health care sector is Exelixis, Inc. (NASDAQ:EXEL) , carrying a Zacks Rank #2 (Buy). You can see the complete list of today’s Zacks #1 Rank (Strong Buy) stocks here.
Exelixis’ earnings per share estimates increased from 26 cents to 45 cents for 2017 and from 63 cents to 70 cents for 2018 over the last 30 days. The company delivered positive earnings surprise in all the four trailing quarters with an average beat of 572.92%. The company’s shares are up 77% so far this year.
Today's Stocks from Zacks' Hottest Strategies
It's hard to believe, even for us at Zacks. But while the market gained +18.8% from 2016 - Q1 2017, our top stock-picking screens have returned +157.0%, +128.0%, +97.8%, +94.7%, and +90.2% respectively.
And this outperformance has not just been a recent phenomenon. Over the years it has been remarkably consistent. From 2000 - Q1 2017, the composite yearly average gain for these strategies has beaten the market more than 11X over. Maybe even more remarkable is the fact that we're willing to share their latest stocks with you without cost or obligation.
Through many years of frustration among gold bugs due to the failure of gold stock prices to leverage the gold prices in a positive way, there were very clear reasons for that...
I know there is the smell of fear in the air when I see my readership double as we reach a point where weekly chart factors come into play. Up until last week, markets have...
Professional traders get paid because of one skill and one skill only: the ability to foresee what the world (or the economy, at least) might look like in six to nine months....
Are you sure you want to block %USER_NAME%?
By doing so, you and %USER_NAME% will not be able to see any of each other's Investing.com's posts.
%USER_NAME% was successfully added to your Block List
Since you’ve just unblocked this person, you must wait 48 hours before renewing the block.
I feel that this comment is:
Thank You!
Your report has been sent to our moderators for review
Add a Comment
We encourage you to use comments to engage with other users, share your perspective and ask questions of authors and each other. However, in order to maintain the high level of discourse we’ve all come to value and expect, please keep the following criteria in mind:
Enrich the conversation, don’t trash it.
Stay focused and on track. Only post material that’s relevant to the topic being discussed.
Be respectful. Even negative opinions can be framed positively and diplomatically. Avoid profanity, slander or personal attacks directed at an author or another user. Racism, sexism and other forms of discrimination will not be tolerated.
Perpetrators of spam or abuse will be deleted from the site and prohibited from future registration at Investing.com’s discretion.