- All Instrument Types
- Indices
- Equities
- ETFs
- Funds
- Commodities
- Currencies
- Crypto
- Bonds
- Certificates
Please try another search

USD On The Cusp - Can It Make The Break?

The U.S. dollar is nearing longer term levels of strength after making a big statement last week – can it follow through to a new highs? The U.S. Retail Sales on tap later today are likely to answer the question for the nearest term.
The Japanese bond market had another crazy session overnight. Trading halted yet again at one point, but the yields backed significantly off the highs of the day by late in the session for the longest end of the yield curve, so I’m wondering if the fears of panic are overblown for the near term. In any case, the USD/JPY blew through 102.00 only to back well off the highs by early European trading. Are we seeing a repeat of the move here that we saw post-BoJ meeting?I’m still not convinced that we can escape a significant JPY rally at some point, and if we dip back through 100, the disappointment will be massive, with the other JPY crosses . Any JPY rally would require two things: a bond rally and a significant broad sell-off in risk assets. This has nothing to do with the longer run prospect for JPY weakness, I must underline. The JPY swoon came after the G7 decided to maintain the line that Japan is not trying to manipulate its currency. Japan will need the rest of the world to maintain its blinders firmly in place, if it continues to get away with its current policy. China will likely be the “first responder” if any single nation is going to respond with concrete policy measures.
Just ahead of the weekend, we got the WSJ Hilsenrath article released just after the close of U.S.trading that was rumoured to exist ahead of the fact. There was nothing particularly earth-shattering in the article of this supposed Fed insider, just straightforward mention of the idea that the Fed could look to taper its asset purchases - though the most interesting idea in the article was that the Fed might look to unwind its buying in somewhat less predictable fashion than it unwound accommodation under Greenspan from 2004 and onwards.
Looking ahead
Data due today is the latest U.S. Retail Sales data Retail activity has been an area of significant disappointment this year, with an outright negative Less Autos and Gas number last month and another negative one expected today. Look for positive data to be greeted with more USD/JPY upside and an especially bad one to provide a more mixed reaction.
Technical highlights
See today’s Trade Navigator for all of your important levels. Below is my attempt at putting some colour on the day’s/week’s possible direction.
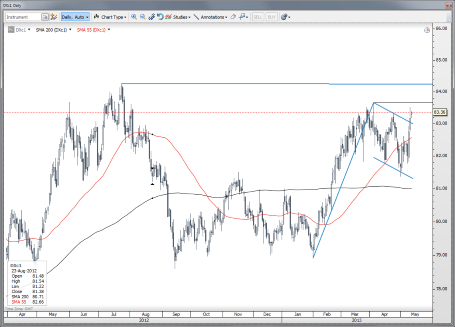
Chart: Dollar Index
Interesting to note that we have broken the upper bound of the flag formation in the U.S. dollar index, and could be looking at new multi-year highs if we get through this local flat-line resistance.

EUR/USD – all about 1.3000, though so far daily pivot just below was the actual resistance level of note. I’m concerned that we have one last treacherous stop-fest back above 1.3000 before we collapse, but must have a short on nonetheless. Any squeeze would need to close above the 1.3030/60 area to weaken my downside conviction.
USD/JPY – 100.00 is now key structural support. 102.50 is resistance – still interested to see whether we get that massive JPY short cover at some point if risk assets swoon – but no real technical warning signals just yet. If we did see a sell-off starting, this would confirm divergent momentum on the weekly chart. If government bond markets continue to crumble We could actually get parabolic moves the other way.
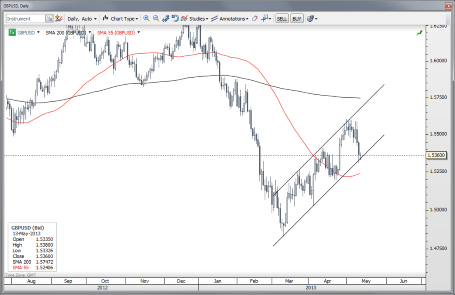
GBP/USD – a nice test of the lower edge of the channel. The channel is beautiful and perfect, and I suspect it will be broken very soon, as these formations never last forever and break at the point of maximum beauty, so to say. Resistance comes in at day pivot in 1.5380 area as we saw already this morning. Above there, a squeeze could see us testing 1.5400 and even 1.5450 in the worst instance, but I’m firmly in “let’s test 1.5000” mode.
Chart: GBPUSD

USD/CHF – particularly interesting; focus is structurally long with possible parity test in the cards eventually. Question is whether we have some throwback treachery first with 0.9550/0.9500 as the zone of possible support.
AUD/USD – parity taken out, rather impressively. If this is too much, too soon, we might see a backup to 1.0100/1.0120, but the die appears cast for more downside. Note that the lows were just below the 61.8% retracement of the move from the summer 2012 low (sub-0.9600) to the 1.0600+ highs.
USD/CAD – looking for a turnaround back higher with 1.0100 as first support.
Economic Data Highlights
- New Zealand Apr. REINZ Housing Price Index out at +0.8% MoM and House Sales up 25.2% YoY#
- Australia Apr. NAB Business Conditions out at -6 vs. -7 in Mar.
- Australia Apr. Business Confidence out at -2 vs. +2 in Mar.
- China Apr. Industrial Production out at +9.3% YoY vs. +9.4% expected and +8.9% in Mar.
- China Apr. Retail Sales out at +12.8% YoY as expected and vs. +12.6% YoY in Mar.
- Switzerland Mar. Retail Sales out at -0.9% YoY vs. +2.3% in Feb.
- US Apr. Advance Retail Sales (1230)
- US Fed’s Plosser to Speak (1530)
- New Zealand Q1 Retail Sales (2245)
- UK Apr. RICS House Price Balance (2301)
- Japan Apr. Domestic Corporate Goods Price Index (2350)
Related Articles

As investors attempt to keep up with the daily shift in President Trump’s tariff policies, the February CPI report out of the United States on Wednesday will likely come as a...
Japanese yen extends rally for a third consecutive day BoJ’s Uchida says rate hikes still on the table despite tariff concerns US nonfarm payrolls expected to edge slightly The...

EUR/USD is trading near 1.0806 on Friday, maintaining its position despite failing to extend its gains further. Investors’ focus is on February’s upcoming US employment data,...
Are you sure you want to block %USER_NAME%?
By doing so, you and %USER_NAME% will not be able to see any of each other's Investing.com's posts.
%USER_NAME% was successfully added to your Block List
Since you’ve just unblocked this person, you must wait 48 hours before renewing the block.
I feel that this comment is:
Thank You!
Your report has been sent to our moderators for review


Add a Comment
We encourage you to use comments to engage with other users, share your perspective and ask questions of authors and each other. However, in order to maintain the high level of discourse we’ve all come to value and expect, please keep the following criteria in mind:
Enrich the conversation, don’t trash it.
Stay focused and on track. Only post material that’s relevant to the topic being discussed.
Be respectful. Even negative opinions can be framed positively and diplomatically. Avoid profanity, slander or personal attacks directed at an author or another user. Racism, sexism and other forms of discrimination will not be tolerated.
Perpetrators of spam or abuse will be deleted from the site and prohibited from future registration at Investing.com’s discretion.