


Sign up to create alerts for Instruments,
Economic Events and content by followed authors
Free Sign Up Already have an account? Sign In
Please try another search

Here are four stocks with buy rank and strong value characteristics for investors to consider today, November 14th:
American Axle & Manufacturing Holdings, Inc. (AXL): This manufacturer of driveline and drivetrain systems has a Zacks Rank #1 (Strong Buy), and seen the Zacks Consensus Estimate for its current year earnings rising 6.4% over the last 60 days.
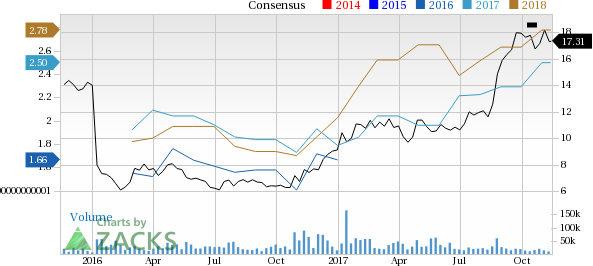
American Axle & Manufacturing Holdings, Inc. Price and Consensus
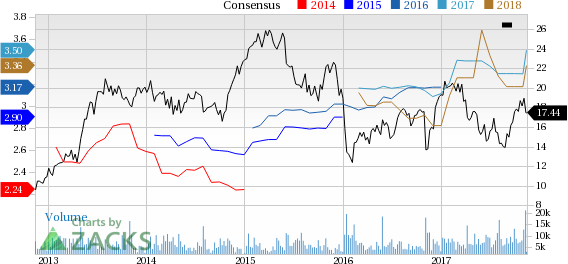
American Axle & Manufacturing Holdings, Inc. Price and Consensus | American Axle & Manufacturing Holdings, Inc. Quote
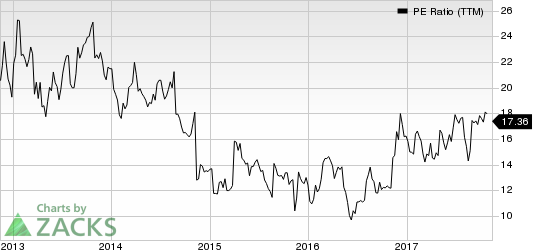
American Axle & Manufacturing Holdingshas a price-to-earnings ratio (P/E) of 4.98, compared with 11.5 for the industry. The company possesses a Value Scoreof A.
American Axle & Manufacturing Holdings, Inc. PE Ratio (TTM)
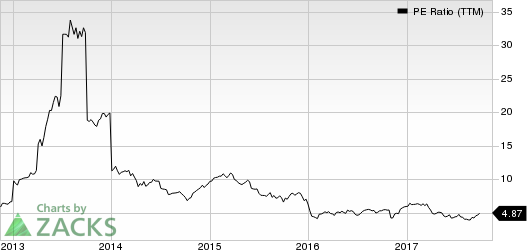
American Axle & Manufacturing Holdings, Inc. pe-ratio-ttm | American Axle & Manufacturing Holdings, Inc. Quote
Movado Group, Inc. (MOV): This designer and developer of fine watches has a Zacks Rank #2 (Buy), and seen the Zacks Consensus Estimate for its current year earnings rising 1.3% over the last 60 days.
Movado Group Inc. Price and Consensus
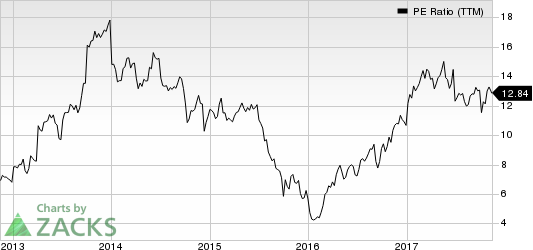
Movado Group has a price-to-earnings ratio (P/E) of 16.76, compared with 21 for the industry. The company possesses a Value Score of A.
Movado Group Inc. PE Ratio (TTM)
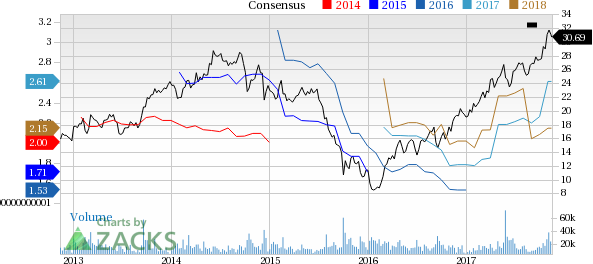
Fiat Chrysler Automobiles N.V. (FCAU): This manufacturer of vehicles components and production systems has a Zacks Rank #2 (Buy), and seen the Zacks Consensus Estimate for its current year earnings rising 2.9% over the last 60 days.
Fiat Chrysler Automobiles N.V. Price and Consensus
Fiat Chrysler Automobiles has a price-to-earnings ratio (P/E) of 6.12, compared with 11.8 for the industry. The company possesses a Value Score of A.
Fiat Chrysler Automobiles N.V. PE Ratio (TTM)
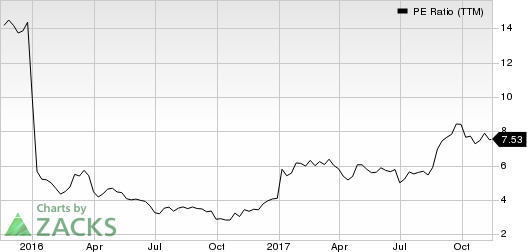
Fiat Chrysler Automobiles N.V. pe-ratio-ttm | Fiat Chrysler Automobiles N.V. Quote
Huntsman Corporation (HUN): This manufacturer of organic and inorganic chemical products has a Zacks Rank #2 (Buy), and seen the Zacks Consensus Estimate for its current year earnings rising 18.6% over the last 60 days.
Huntsman Corporation Price and Consensus
Huntsman Corporation has a price-to-earnings ratio (P/E) of 11.9, compared with 18.9 for the industry. The company possesses a Value Score of A.
Huntsman Corporation PE Ratio (TTM)
See the full list of top ranked stocks here
Learn more about the Value score and how it is calculated here.
Today's Stocks from Zacks' Hottest Strategies
It's hard to believe, even for us at Zacks. But while the market gained +18.8% from 2016 - Q1 2017, our top stock-picking screens have returned +157.0%, +128.0%, +97.8%, +94.7%, and +90.2% respectively.
And this outperformance has not just been a recent phenomenon. Over the years it has been remarkably consistent. From 2000 - Q1 2017, the composite yearly average gain for these strategies has beaten the market more than 11X over. Maybe even more remarkable is the fact that we're willing to share their latest stocks with you without cost or obligation.
The big US stocks dominating markets and investors’ portfolios just finished another earnings season. They reported spectacular collective results including record sales, profits,...
“Quality” stocks with strong fundamentals tend to be rewarding places to stash hard-earned money. Since 2009, investing in a basket of quality stocks over a standard index has...
Palantir Technologies (NASDAQ:PLTR) continues to sell off. On March 6, PLTR stock fell over 10% on nearly double the daily volume, bringing its 30-day decline to over 27%. A drop...
Are you sure you want to block %USER_NAME%?
By doing so, you and %USER_NAME% will not be able to see any of each other's Investing.com's posts.
%USER_NAME% was successfully added to your Block List
Since you’ve just unblocked this person, you must wait 48 hours before renewing the block.
I feel that this comment is:
Thank You!
Your report has been sent to our moderators for review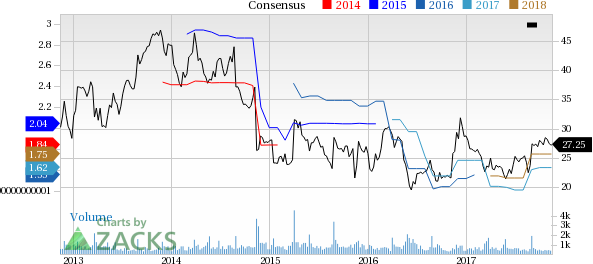

Add a Comment
We encourage you to use comments to engage with other users, share your perspective and ask questions of authors and each other. However, in order to maintain the high level of discourse we’ve all come to value and expect, please keep the following criteria in mind:
Enrich the conversation, don’t trash it.
Stay focused and on track. Only post material that’s relevant to the topic being discussed.
Be respectful. Even negative opinions can be framed positively and diplomatically. Avoid profanity, slander or personal attacks directed at an author or another user. Racism, sexism and other forms of discrimination will not be tolerated.
Perpetrators of spam or abuse will be deleted from the site and prohibited from future registration at Investing.com’s discretion.