


Sign up to create alerts for Instruments,
Economic Events and content by followed authors
Free Sign Up Already have an account? Sign In
Please try another search

T-Mobile US Inc’s (NYSE:T) rating was recently upgraded to Ba2 (in certain metrics) by credit rating agency Moody's Investors Service (also known as Moody’s). Moreover, the company’s rating outlook has been confirmed stable.
Currently, T-Mobile US carries a Zacks Rank #3 (Hold). You can see the complete list of today’s Zacks #1 Rank (Strong Buy) stocks here.
Moody's upgraded T-Mobile US' corporate family rating (CFR) to Ba2 from Ba3. The company’s probability of default rating was upgraded to Ba2-PD from Ba3-PD, its senior secured rating to Baa2 from Baa3 and its senior unsecured rating to Ba2 from Ba3. The Speculative Grade Liquidity Rating (SGL-1) was affirmed.
Why the Elevation?
T-Mobile US' innovative network expansion methodologies and improvement plans, stellar network performance, deployment of LTE-U technology and offering of attractive unlimited data are key factors behind the upgraded ratings. This is further supported by improving scale, healthy free cash flow generation, strong liquidity and valuable spectrum assets that also provide credit support. These positives are, however, offset by the company's third position in the domestic wireless industry.
The elevation also follows the decision of T-Mobile US and Sprint Corp (NYSE:S) to call off a potential merger. The merger could have pressurized T-Mobile US’ credit metrics, on materialization
The SGL-1 speculative grade liquidity rating justifies the company’s healthy liquidity position. Notably, in the third quarter of 2017, T-Mobile US generated $2,362 million of cash from operations compared with $1,740 million in the prior-year quarter. Free cash flow in the reported quarter was $921 million, up from $581 million in the year-ago quarter. As of Sep 30, the company had $739 million of cash and cash equivalents and $15,144 million of debt outstanding compared with $5,500 million and $22,186 million, respectively, at the end of 2016. The debt-to-capitalization ratio was 0.42 compared with 0.54 at the end of 2016. We believe that the company’s improved liquidity has strengthened Moody's expectation.
The stable outlook reflects T-Mobile US’ strong fundamentals, growth and improving credit metrics. This was balanced by management's leverage tolerance as indicated by its target capital structure.
Moody's Anticipation
Moody's expects T-Mobile US to generate healthy free cash flow in the next few years. It believes that the company is operating below its stated target leverage range. Moody's also expects the company’s credit metrics to remain stable, despite the highly competitive domestic wireless environment. This will be driven by continued postpaid phone subscriber growth, effective marketing schemes and improved cost management. T-Mobile US’ organic EBITDA growth is expected to remain strong.
Bottom line
Accumulating debt and declining cash flows can severely affect a company’s margins and credit ratings. Impressive operating metrics, and cash and liquidity structure in the third quarter of 2017 uplifted T-Mobile US.
We believe that T-Mobile US’ ratings could have been better, had the company’s financial policy been changed to reflect lower leverage tolerance.
However, if the company fails to generate more cash flows and reduce debt, ratings can deteriorate. Henceforth, T-Mobile US should ensure that EBITDA margins are not subject to sustained pressure. Moreover, the company’s future debt-funded share repurchases should not exceed its expectations.
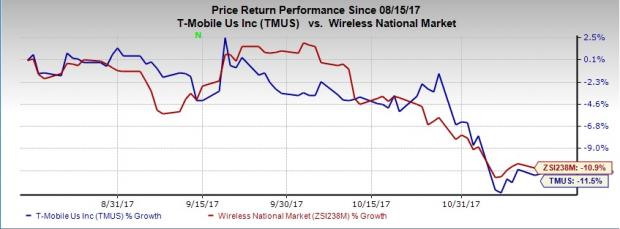
Price Performance
Despite such positives, T-Mobile US portrays a disappointing price performance. In the past three months, the company’s shares have lost 11.5% compared with the industry’s loss of 10.9%.
We believe that the company’s operation in the highly competitive and saturated U.S. wireless market have led to the declining price performance. Moreover, success in the wireless service business largely depends on technical superiority, quality of services and scalability. In all three areas, T-Mobile US is far behind its peers Verizon Communications Inc (NYSE:VZ) and AT&T Inc (NYSE:T) . Such competition could limit the company’s ability to attract and retain customers and adversely affect results.
The Hottest Tech Mega-Trend of All
Last year, it generated $8 billion in global revenues. By 2020, it's predicted to blast through the roof to $47 billion. Famed investor Mark Cuban says it will produce "the world's first trillionaires," but that should still leave plenty of money for regular investors who make the right trades early.
See Zacks' 3 Best Stocks to Play This Trend >>
Defense stocks took a tumble heading into 2025 as President Trump returned to the White House for his second term. Trump has stated his intent as a peacemaker to bring the wars in...
Using the Elliott Wave Principle (EWP), we have been tracking the most likely path forward for the Nasdaq 100 (NDX). Although there are many ways to navigate the markets and to...
Investors are on edge about what tariff policy means for markets Coming off a strong Q4 earnings season, fresh February corporate sales figures can help assess the macro...
Are you sure you want to block %USER_NAME%?
By doing so, you and %USER_NAME% will not be able to see any of each other's Investing.com's posts.
%USER_NAME% was successfully added to your Block List
Since you’ve just unblocked this person, you must wait 48 hours before renewing the block.
I feel that this comment is:
Thank You!
Your report has been sent to our moderators for review
Add a Comment
We encourage you to use comments to engage with other users, share your perspective and ask questions of authors and each other. However, in order to maintain the high level of discourse we’ve all come to value and expect, please keep the following criteria in mind:
Enrich the conversation, don’t trash it.
Stay focused and on track. Only post material that’s relevant to the topic being discussed.
Be respectful. Even negative opinions can be framed positively and diplomatically. Avoid profanity, slander or personal attacks directed at an author or another user. Racism, sexism and other forms of discrimination will not be tolerated.
Perpetrators of spam or abuse will be deleted from the site and prohibited from future registration at Investing.com’s discretion.