


Sign up to create alerts for Instruments,
Economic Events and content by followed authors
Free Sign Up Already have an account? Sign In
Please try another search

Telephone & Data Systems Inc. (NYSE:TDS) reported disappointing financial results in the third quarter of 2017, wherein both the top and the bottom line missed the Zacks Consensus Estimate.
GAAP net loss in the reported quarter was $181 million or a loss of $1.64 per share against net income of $13 million or 12 cents per share in the year-ago quarter. Quarterly adjusted earnings per share of 8 cents were well below the Zacks Consensus Estimate of 17 cents.
Telephone and Data Systems, Inc. Price, Consensus and EPS Surprise
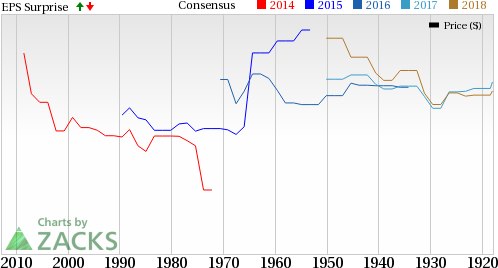
Telephone and Data Systems, Inc. Price, Consensus and EPS Surprise | Telephone and Data Systems, Inc. Quote
Revenues declined 5% year over year to $1,251 million in the reported quarter, underperforming the Zacks Consensus Estimate of $1,275 million. Operating expenses were $1,483 million, reflecting an increase of 16% year over year. The company reported quarterly operating loss of $360 million against an operating income of $22 million in the year-ago quarter.
United States Cellular Division
GAAP net loss of United States Cellular Corp. (NYSE:USM) came in at $299 million or a loss of $3.51 per share against net income of $17 million or 20 cents per share in the year-ago quarter. However, quarterly adjusted earnings per share of 11 cents were well above the Zacks Consensus Estimate of a penny per share.
Quarterly total revenues of $963 million declined 6% year over year. Also, it missed the Zacks Consensus Estimate of $976.5 million. Quarterly Service revenues decreased 6% to $737 million. Revenues from Equipment sales decreased 5% to $226 million.
Quarterly postpaid ARPU (average revenue per user) decreased to $43.41 from $45.19 at the end of 2016. Postpaid ARPA (average revenue per account) was $116.36 compared with $120.67 at the end of 2016. Postpaid churn declined to 1.16% from 1.41% registered at the end of 2016. Prepaid ARPU decreased to $33.12 from $33.25 registered at the end of 2016. Prepaid churn decreased to 4.75% in the reported quarter from 5.44% at 2016-end.
United States Cellular exited the third quarter of 2017 with a subscriber base of 5,089,000 compared with 5,031,000 at the end of 2016. Postpaid subscriber base totaled 4,513,000 compared with 4,482,000 at the end of 2016. Prepaid subscriber base totaled 515,000, compared with 484,000 at the end of 2016. In the reported quarter, United States Cellular gained a net of 35,000 postpaid subscribers compared with a net loss of 6,000 customers in the year-ago quarter. The company gained 31,000 prepaid customers in the same quarter compared with 67,000 users in the prior-year quarter.
TDS Division
In the reported quarter, total revenues came in at $285 million, reflecting a decline of 1% year over year. Within the segment, revenues from the wireline segment came in at $179 million, up 2% year over year. Cable revenues were $52 million, reflecting an increase of 12% year over year while HMS revenues decreased 18% to $56 million.
Telephone & Data Systems currently carries a Zacks Rank #3 (Hold). You can see the complete list of today’s Zacks #1 Rank (Strong Buy) stocks here. The company is a leading regional wireline voice and video service provider in the U.S. and competes with the likes of CenturyLink Inc. (NYSE:CTL) and Frontier Communications Corp. (NASDAQ:FTR) .
Cash Flow
In the second quarter of 2017, Telephone & Data Systems generated $263 million of cash from operations compared with $238 million in the prior-year quarter. Quarterly free cash flow was $107 million compared with $93 million in the year-earlier quarter.
Liquidity
Telephone & Data Systems exited the third quarter of 2017 with cash and short-term investment of $884 million compared with $900 million at the end of 2016. Total debt was $2,463 million compared with $2,445 million at the end of 2016. At the end of the third quarter of 2017, the debt-to-capitalization ratio was 0.35 compared with 0.34 at the end of 2016.
Subscriber Statistics
At the end of the third quarter of 2017, Telephone & Data Systems had 575,300 residential wireline connections compared with 590,900 in the year-ago quarter. Of the total, voice connections were 298,200, decreasing 5.2% year over year. Broadband Connections were 229,900, down 0.9% year over year. IPTV connections were 47,200, up 8.3% year over year. Quarterly total residential revenues per connection were $46.07 compared with $44.25 in the year-ago quarter.
The company exited the third quarter of 2017 with 315,300 commercial wireline connections, down 5.6% year over year. Of the total, voice connections were 146,900, down 8.7% year over year. Broadband Connections were 20,900, declining 3.7% year over year. ManagedIP connections were 147,600, down 2.6% year over year.
Total cable connections were 300,600, up 3.3% year over year. Of the total, Broadband Connections were 143,800, up 10.4% year over year. Video connections were 97,900, down 3.2% year over year. Voice connections were 58,900, down 1.5% year over year.
Guidance for 2017 (for TDS Division)
For 2017, Telephone & Data Systems projects total operating revenues in the range of $1,125 – $1,150 million. Adjusted EBITDA and adjusted OIBDA are expected in the band of $300 – $340 million while capital expenditure is projected at around $225 million.
Today's Stocks from Zacks' Hottest Strategies
It's hard to believe, even for us at Zacks. But while the market gained +18.8% from 2016 - Q1 2017, our top stock-picking screens have returned +157.0%, +128.0%, +97.8%, +94.7%, and +90.2% respectively.
And this outperformance has not just been a recent phenomenon. Over the years it has been remarkably consistent. From 2000 - Q1 2017, the composite yearly average gain for these strategies has beaten the market more than 11X over. Maybe even more remarkable is the fact that we're willing to share their latest stocks with you without cost or obligation.
See Them Free>>
Through many years of frustration among gold bugs due to the failure of gold stock prices to leverage the gold prices in a positive way, there were very clear reasons for that...
I know there is the smell of fear in the air when I see my readership double as we reach a point where weekly chart factors come into play. Up until last week, markets have...
Oracle (NYSE:ORCL) reports after the closing bell Monday, March 10th, 2025, with street consensus expecting $1.49 in earnings per share on $14.39 billion in revenue, for expected...
Are you sure you want to block %USER_NAME%?
By doing so, you and %USER_NAME% will not be able to see any of each other's Investing.com's posts.
%USER_NAME% was successfully added to your Block List
Since you’ve just unblocked this person, you must wait 48 hours before renewing the block.
I feel that this comment is:
Thank You!
Your report has been sent to our moderators for review
Add a Comment
We encourage you to use comments to engage with other users, share your perspective and ask questions of authors and each other. However, in order to maintain the high level of discourse we’ve all come to value and expect, please keep the following criteria in mind:
Enrich the conversation, don’t trash it.
Stay focused and on track. Only post material that’s relevant to the topic being discussed.
Be respectful. Even negative opinions can be framed positively and diplomatically. Avoid profanity, slander or personal attacks directed at an author or another user. Racism, sexism and other forms of discrimination will not be tolerated.
Perpetrators of spam or abuse will be deleted from the site and prohibited from future registration at Investing.com’s discretion.