


Sign up to create alerts for Instruments,
Economic Events and content by followed authors
Free Sign Up Already have an account? Sign In
Please try another search

It has been more than a month since the last earnings report for Sun Life Financial Inc. (TO:SLF) . Shares have added about 4.9% in that time frame, outperforming the market.
Will the recent positive trend continue leading up to the stock's next earnings release, or is it due for a pullback? Before we dive into how investors and analysts have reacted as of late, let's take a quick look at its most recent earnings report in order to get a better handle on the important drivers.
Sun Life Financial Q3 Earnings Grow Y/Y, Dividend Up
Sun Life Financial reported third-quarter 2017 underlying net income of $513 million (C$643 million), up 0.6% year over year.
Sun Life witnessed improved results at three of its segments.
Life and health sales decreased 9.4% year over year to $446 million (C$599 million), while wealth sales inched up 1.7% year over year to $28.6 million (C$35.8 billion) in the quarter.
Adjusted premiums and deposits were $33.7 billion (C$42.3 billion), up 3.4% year over year, fueled by higher managed and mutual fund sales.
Net premiums decreased 5.1% year over year to $2.9 billion (C$3.7 billion), attributable to lower premiums from Hong Kong in SLF Asia, Group Benefits in SLF U.S., GRS in SLF Canada and the currency impact from the change in the Canadian dollar. However, higher premiums for in-force management in SLF U.S. limited the downside.
Segment Results
SLF Canada’s underlying net income decreased 1.2% year over year to $177 million (C$222 million). The company witnessed lower investing activity gains on insurance contract liabilities and an unfavorable morbidity experience in Group Benefits. However, growth in fee income on wealth businesses and strong new business gains in GRS and individual insurance, plus an improved expense experience limited the downside.
SLF U.S.’s underlying net income was $129 million, up 25.2% from the year-ago quarter. The increase stemmed from improved morbidity experience in stop-loss and favorable mortality experience in the group life business.
SLF Asset Management’s underlying operating net income of $163 million (C$204 million), increased 8.5% year over year, driven by a solid performance at MFS Investment Management that in turn was fueled by higher average net assets.
SLF Asia reported underlying income of $71.8 million (C$90 million), up 12.5% year over year. Continued growth in fee income business and higher level of gains from investments drove this upside.
Financial Update
Global assets under management were $750 billion (C$934 billion), up 3.4% from the level at 2016-end. Sun Life Assurance’s Minimum Continuing Capital and Surplus Requirements (MCCSR) ratio was 252% as of Sep 30, 2017 compared with 248% as of Jun 30, 2017.
Sun Life reported operating return on equity of 16.2% in the third quarter of 2017, expanding 480 basis points year over year. Underlying ROE of 12.7% deteriorated 100 basis points year over year.
Leverage ratio of 22.5% at the quarter-end remained unchanged from the year-ago quarter-end.
Dividend Update
The board of directors of Sun Life approved a 5% increase in dividend to 45.5 cents per share. The payment will be made on Dec 29, 2017 to shareholders of record on Nov 29, 2017.
How Have Estimates Been Moving Since Then?
Analysts were quiet during the past month as none of them issued any earnings estimate revisions.
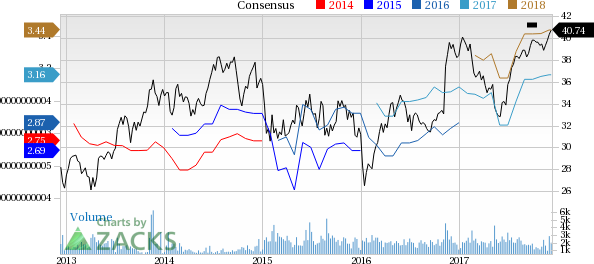
Sun Life Financial Inc. Price and Consensus | Sun Life Financial Inc. Quote
VGM Scores
At this time, the stock has a poor Growth Score of F, however its Momentum is doing a lot better with a C. Charting a somewhat similar path, the stock was allocated a grade of B on the value side, putting it in the second quintile for this investment strategy.
Overall, the stock has an aggregate VGM Score of D. If you aren't focused on one strategy, this score is the one you should be interested in.
Our style scores indicate that the stock is more suitable for value investors than momentum investors.
Outlook
The stock has a Zacks Rank #3 (Hold). We are expecting an inline return from the stock in the next few months.
Since the Robotaxi event on October 11th, Tesla (NASDAQ:TSLA) stock is up 38%, currently priced at $291.60 per share This is a return to the early November 2024 price level. But...
The Q4 2024 earnings season tapers off from here, with S&P 500® EPS growth surpassing 17%, the highest in 3 years Large cap outlier earnings dates this week include:...
Shares of Alibaba (NYSE:BABA) are on a tear to start off 2025. The consumer discretionary and tech stock is up by 52% this year as of the Feb. 25 close. The company’s cloud...
Are you sure you want to block %USER_NAME%?
By doing so, you and %USER_NAME% will not be able to see any of each other's Investing.com's posts.
%USER_NAME% was successfully added to your Block List
Since you’ve just unblocked this person, you must wait 48 hours before renewing the block.
I feel that this comment is:
Thank You!
Your report has been sent to our moderators for review
Add a Comment
We encourage you to use comments to engage with other users, share your perspective and ask questions of authors and each other. However, in order to maintain the high level of discourse we’ve all come to value and expect, please keep the following criteria in mind:
Enrich the conversation, don’t trash it.
Stay focused and on track. Only post material that’s relevant to the topic being discussed.
Be respectful. Even negative opinions can be framed positively and diplomatically. Avoid profanity, slander or personal attacks directed at an author or another user. Racism, sexism and other forms of discrimination will not be tolerated.
Perpetrators of spam or abuse will be deleted from the site and prohibited from future registration at Investing.com’s discretion.