


Sign up to create alerts for Instruments,
Economic Events and content by followed authors
Free Sign Up Already have an account? Sign In
Please try another search

It has been about a month since the last earnings report for S&P Global Inc. SPGI). Shares have added about 3.8% in that time frame.
Will the recent positive trend continue leading up to its next earnings release, or is SPGI due for a pullback? Before we dive into how investors and analysts have reacted as of late, let's take a quick look at the most recent earnings report in order to get a better handle on the important drivers.
S&P Global Tops Q4 Earnings Estimates, '18 View Solid
S&P Global reported solid fourth-quarter 2017 results with adjusted net income of $474 million or $1.85 per share compared with $334 million or $1.28 per share in the year-earlier quarter. Earnings comfortably beat the Zacks Consensus Estimate of $1.63 per share. The rise on the bottom line came on the back of robust organic revenue growth across all segments.
GAAP earnings for the quarter were $263 million or $1.02 per share, compared with $537 million or $2.05 per share in the year-ago quarter. The significant year-over-year decrease in earnings was primarily due to gains culminated in the prior-year quarter from business divestitures. Moreover, tax expenses incurred due to the enactment of the Tax Cuts and Jobs Act in fourth-quarter 2017 further reduced earnings. GAAP earnings for full-year 2017 were $1,496 million or $5.78 per share compared with $2,106 million or $7.94 per share in 2016.
Revenues for the quarter were $1,589 million compared with $1,399 million in the year-ago quarter. Quarterly revenues beat the Zacks Consensus Estimate of $1,503 million. Top-line growth was fueled by solid performance across all segments. Revenues for 2017 were $6,063 million compared with $5,661 million a year ago.
Adjusted operating profit margin for the year declined 1650 basis points (bps) to 43%.
Segmental Details
S&P Global Ratings’ revenues increased 20% year over year to $789 million, chiefly driven by increase in transaction revenues. The growth came on the back of substantial increase in high-yield bond, structured products and bank loan ratings. Moreover, non-transaction revenues increased 12% to $388 million driven by growth in fees associated with surveillance, entity ratings and short-term debt. Adjusted operating profit increased 40% year over year to $439 million for adjusted operating margin of 56% (up 810 bps year over year).
S&P Global Market and Commodities Intelligence revenues increased 7% year over year to $637 million primarily driven by growth in organic revenues. However, the segment’s adjusted operating profit increased 13% to $233 million while adjusted operating profit margin increased 200 bps to 37% led by strong revenue growth, divestments of lower margin businesses and SNL integration synergies.
S&P Dow Jones Indices revenues rose 12% to $191 million in the reported quarter due to a surge in exchange-traded products and increased derivatives trading. Adjusted operating profit increased 16% to $122 million.
Financial Aspects
As of Dec 31 2017, S&P Global had cash and cash equivalents of $2,779 million compared with $2,392 million reported at the end of the previous year. Long-term debt was $3,170 million compared with $3,564 million in the previous year. For 2017, the company generated cash from operating activities to the tune of $2,016 million compared with $1,560 million in the previous year. Also, free cash flow of $1.78 billion was reported, showing an increase of $453 million from the year-ago period.
For 2017, the company returned $1.4 billion to shareholders. This was done through a combination of share repurchases and dividend payouts. It paid out $421 million in dividends and bought shares for $1 billion.
Guidance
Concurrent with the earnings release, the company provided bullish full-year 2018 guidance. Adjusted earnings are expected to be $8.45-$8.60 per share. On a GAAP basis, EPS is expected to be in the range of $8.15 to $8.30. Also, free cash flow of $2.3 billion is expected.
How Have Estimates Been Moving Since Then?
In the past month, investors have witnessed an upward trend in fresh estimates. There has been one revision higher for the current quarter.
VGM Scores
Currently, SPGI has a nice Growth Score of B. Its Momentum is doing a bit better with an A. The stock was allocated a grade of F on the value side, putting it in the fifth quintile for this investment strategy.
Overall, the stock has an aggregate VGM Score of C. If you aren't focused on one strategy, this score is the one you should be interested in.
Our style scores indicate that the stock is more suitable for momentum investors than growth investors.
Outlook
Estimates have been trending upward for the stock and the magnitude of this revision looks promising. It comes with little surprise that SPGI has a Zacks Rank #2 (Buy). We expect an above average return from the stock in the next few months.
Since the Robotaxi event on October 11th, Tesla (NASDAQ:TSLA) stock is up 38%, currently priced at $291.60 per share This is a return to the early November 2024 price level. But...
The Q4 2024 earnings season tapers off from here, with S&P 500® EPS growth surpassing 17%, the highest in 3 years Large cap outlier earnings dates this week include:...
Shares of Alibaba (NYSE:BABA) are on a tear to start off 2025. The consumer discretionary and tech stock is up by 52% this year as of the Feb. 25 close. The company’s cloud...
Are you sure you want to block %USER_NAME%?
By doing so, you and %USER_NAME% will not be able to see any of each other's Investing.com's posts.
%USER_NAME% was successfully added to your Block List
Since you’ve just unblocked this person, you must wait 48 hours before renewing the block.
I feel that this comment is:
Thank You!
Your report has been sent to our moderators for review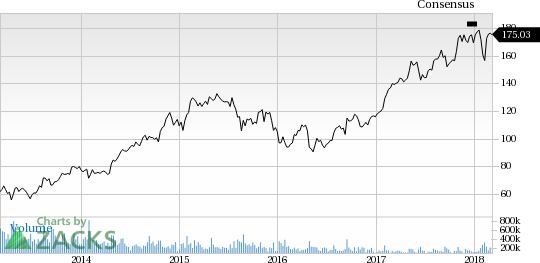

Add a Comment
We encourage you to use comments to engage with other users, share your perspective and ask questions of authors and each other. However, in order to maintain the high level of discourse we’ve all come to value and expect, please keep the following criteria in mind:
Enrich the conversation, don’t trash it.
Stay focused and on track. Only post material that’s relevant to the topic being discussed.
Be respectful. Even negative opinions can be framed positively and diplomatically. Avoid profanity, slander or personal attacks directed at an author or another user. Racism, sexism and other forms of discrimination will not be tolerated.
Perpetrators of spam or abuse will be deleted from the site and prohibited from future registration at Investing.com’s discretion.