


Sign up to create alerts for Instruments,
Economic Events and content by followed authors
Free Sign Up Already have an account? Sign In
Please try another search

"Should you find yourself in a chronically leaking boat, energy devoted to changing vessels is likely to be more productive than energy devoted to patching leaks."- Warren Buffett.
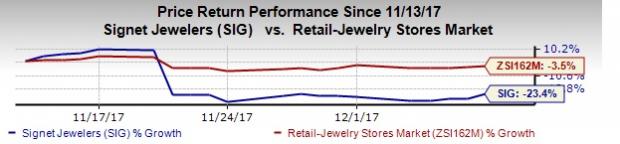
At the moment, the quote fits perfectly for Signet Jewelers Limited (NYSE:SIG) as the company’s near-term future looks bleak. Investors need to exercise extreme caution when it comes to the stock as it is unlikely to show any major improvement in the near term. Signet has exhibited a bearish run in a month, with stock plunging 23.4%, wider than the industry’s decline of 3.5%. Let’s delve deeper and try to assess what’s taking this Zacks Rank #4 (Sell) company downhill.
Tepid Guidance
Signet, which recently concluded the first phase of outsourcing of its credit portfolio to Alliance Data Systems (NYSE:ADS) as well as Genesis Financial Solutions, faced glitches in the credit transition process. The problem is likely to persist in the final quarter as well.
Consequently, the company trimmed fiscal 2018 guidance. It now expects earnings per share in the range of $6.10-$6.50, sharply down from the prior guidance of $7.16-$7.56. Moreover, same store sales are anticipated to decline by mid-single digit, compared with the prior estimate of down low to mid-single digit. The company anticipates fourth-quarter same store sales to decline in the range of low to mid-single digits.
Following dismal guidance, the Zacks Consensus Estimate for fourth quarter and fiscal 2018 have declined by 46 cents and 67 cents to $4.04 and $6.41, respectively.
Dismal Revenues Trend a Concern
Signet reported lower-than-expected revenues for the eighth time in last ten quarters, when the company posted third-quarter fiscal 218 results. Total sales of $1,156.9 million decreased 2.5% year over year and also came below the Zacks Consensus Estimate of $1,172 million. Sales were negatively impacted by lower bridal sales and customer transactions. Moreover, same store sales were down 5% compared with a decrease of 2% registered in the prior-year period due to hurricanes and glitches in the credit transition process.
Gross Margin Continues its Downtrend
Gross margin, an important financial metric that gives an indication about the company’s health has shown constant deceleration in the past few quarters. In third-quarter fiscal 2018, gross margin contracted 170 basis points (bps) to 27.8% following a decline of 120 bps and 300 bps to 32.7% and 35%, respectively, in the preceding two quarters. Decline in gross margin is primarily due to rise in promotional activities, which in turn lowered merchandize margin rate.
Still Interested in the Retail Space? Check These
Better-ranked stocks worth considering in the retail space include Movado Group, Inc. (NYSE:MOV) , American Eagle Outfitters, Inc. (NYSE:AEO) and Urban Outfitters, Inc. (NASDAQ:URBN) . All three stocks sport a Zacks Rank #1 (Strong Buy). You can see the complete list of today’s Zacks #1 Rank stocks here.
Shares of Movado Group have gained 12.1% in a month.
American Eagle Outfitters stock has surged 33.2% in the past three months and also has long-term earnings growth rate of 8.7%.
Urban Outfitters has an impressive long-term earnings growth rate of 12%.
Today's Stocks from Zacks' Hottest Strategies
It's hard to believe, even for us at Zacks. But while the market gained +18.8% from 2016 - Q1 2017, our top stock-picking screens have returned +157.0%, +128.0%, +97.8%, +94.7%, and +90.2% respectively.
And this outperformance has not just been a recent phenomenon. Over the years it has been remarkably consistent. From 2000 - Q1 2017, the composite yearly average gain for these strategies has beaten the market more than 11X over. Maybe even more remarkable is the fact that we're willing to share their latest stocks with you without cost or obligation.
Regimes are changing in the market, and this could mean a few things, but today, it means that volatility is back. Whenever these shifts come, specifically to the S&P 500...
There are more than two reasons why NVIDIA’s (NASDAQ:NVDA) stock price can rally another 30% or more in 2025, but the two that underpin the others are data center and automotive...
Stocks fell sharply, with the S&P 500 leading the decline, finishing the day down almost 1.6% at 5,860. Meanwhile, the Nasdaq 100 dropped nearly 2.75%, closing at 20,550. This...
Are you sure you want to block %USER_NAME%?
By doing so, you and %USER_NAME% will not be able to see any of each other's Investing.com's posts.
%USER_NAME% was successfully added to your Block List
Since you’ve just unblocked this person, you must wait 48 hours before renewing the block.
I feel that this comment is:
Thank You!
Your report has been sent to our moderators for review
Add a Comment
We encourage you to use comments to engage with other users, share your perspective and ask questions of authors and each other. However, in order to maintain the high level of discourse we’ve all come to value and expect, please keep the following criteria in mind:
Enrich the conversation, don’t trash it.
Stay focused and on track. Only post material that’s relevant to the topic being discussed.
Be respectful. Even negative opinions can be framed positively and diplomatically. Avoid profanity, slander or personal attacks directed at an author or another user. Racism, sexism and other forms of discrimination will not be tolerated.
Perpetrators of spam or abuse will be deleted from the site and prohibited from future registration at Investing.com’s discretion.