


Sign up to create alerts for Instruments,
Economic Events and content by followed authors
Free Sign Up Already have an account? Sign In
Please try another search

Value investing is easily one of the most popular ways to find great stocks in any market environment. After all, who wouldn’t want to find stocks that are either flying under the radar and are compelling buys, or offer up tantalizing discounts when compared to fair value?
One way to find these companies is by looking at several key metrics and financial ratios, many of which are crucial in the value stock selection process. Let’s put Triumph Group, Inc. (NYSE:TGI) stock into this equation and find out if it is a good choice for value-oriented investors right now, or if investors subscribing to this methodology should look elsewhere for top picks:
PE Ratio
A key metric that value investors always look at is the Price to Earnings Ratio, or PE for short. This shows us how much investors are willing to pay for each dollar of earnings in a given stock, and is easily one of the most popular financial ratios in the world. The best use of the PE ratio is to compare the stock’s current PE ratio with: a) where this ratio has been in the past; b) how it compares to the average for the industry/sector; and c) how it compares to the market as a whole.
On this front, Triumph Group has a trailing twelve months PE ratio of 6.17, as you can see in the chart below:
.jpg)
.jpg)
.jpg)
.jpg)
Triumph Group, Inc. Price and Consensus
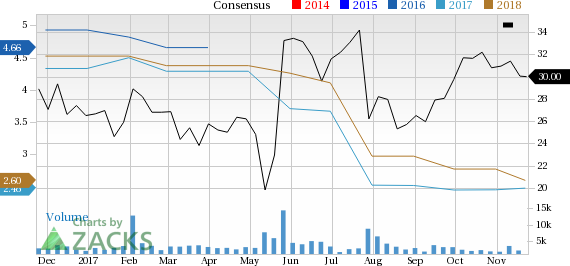
Triumph Group, Inc. Price and Consensus | Triumph Group, Inc. Quote
However, this somewhat bullish trend has likely not yet been reflected in the stock, as we have just a Zacks Rank #3 (Hold), which indicates expectations of in-line performance in the near term. Nonetheless, the bullish analyst sentiment indicates that the stock’s prospects in the near term look good.
Bottom Line
Triumph Group is an inspired choice for value investors, as it is hard to beat its incredible lineup of statistics on this front. Despite having a Zacks Rank #3, the stock belongs to an industry which is ranked among the Top 39%, which indicates that broader factors are favorable for the company. Further, over the past two years, the industry has outperformed the broader market, as you can see below:
.jpg)
When looking for dividend stocks, high dividend yields are one important factor to consider. Even if a company’s dividend yield isn’t nearing double-digit percentages, finding...
Whenever Wall Street authoritative figures, such as a large institution or individual investor, decide to shift a view on a specific stock or industry, retail traders can...
Monster Beverage (NASDAQ:MNST) faces headwinds that make it a potentially scary buy, including weakness in the alcohol segment. With the alcohol business contracting in Q4 2024,...
Are you sure you want to block %USER_NAME%?
By doing so, you and %USER_NAME% will not be able to see any of each other's Investing.com's posts.
%USER_NAME% was successfully added to your Block List
Since you’ve just unblocked this person, you must wait 48 hours before renewing the block.
I feel that this comment is:
Thank You!
Your report has been sent to our moderators for review
Add a Comment
We encourage you to use comments to engage with other users, share your perspective and ask questions of authors and each other. However, in order to maintain the high level of discourse we’ve all come to value and expect, please keep the following criteria in mind:
Enrich the conversation, don’t trash it.
Stay focused and on track. Only post material that’s relevant to the topic being discussed.
Be respectful. Even negative opinions can be framed positively and diplomatically. Avoid profanity, slander or personal attacks directed at an author or another user. Racism, sexism and other forms of discrimination will not be tolerated.
Perpetrators of spam or abuse will be deleted from the site and prohibited from future registration at Investing.com’s discretion.