- All Instrument Types
- Indices
- Equities
- ETFs
- Funds
- Commodities
- Currencies
- Crypto
- Bonds
- Certificates
Please try another search

S&P 500: Another Look At Volatility Points To Steady Bull Market

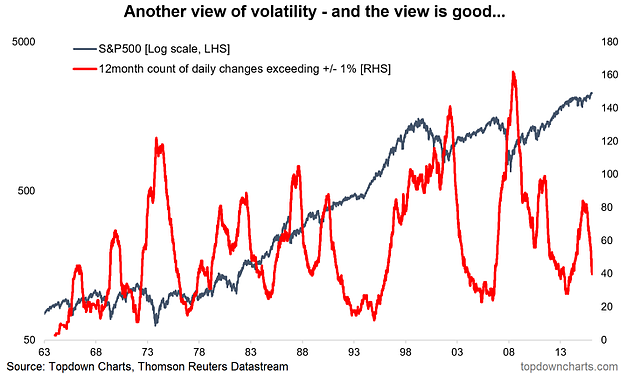
This article takes an alternative view on volatility. Rather than the usual CBOE VIX - a volatility index derived from option pricing, the metrics below look at actual changes in prices. The index looked at is the S&P 500 (will have a look at a few other indexes later). The first chart shows the rolling 12 month count of days where the daily percent change exceeded +1% or was worse than -1%. The resulting indicator provides some interesting insights and potential signals...

What sticks out to me is that the indicator rises into a correction or bear market and peaks at the bottom of the market e.g. 2016 bottom, 2011, 2009, 2003, and so-on. What's also interesting is when the indicator rolls over and heads below 50. Usually this happens when a bull market gets under way. We're seeing exactly this pattern right now.
It also highlights that there are two types of bull markets: a bull market where volatility rises (an erratic bull market), and a bull market where volatility falls and stays low (a steady bull market). At present we appear to be in the middle of a steady bull market, and these can go on for quite some time.
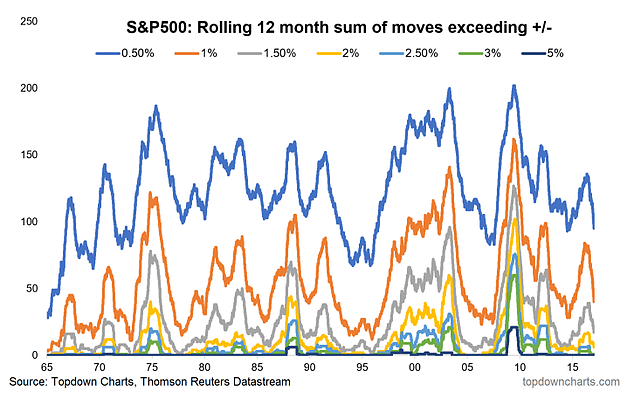
Finally, it's worth a quick look at the spectrum of moves. The following graph looks at the same indicator but for various different threshold magnitudes e.g. 0.5% and 5%. It gives a further insight into how erratically a market is moving... just compare and contrast 2008 with 2005.

Taking alternative views of markets and economies is important. At Topdown Charts there is an emphasis on innovation, coming up with new indicators and new ways of analyzing the market as well as refining and leveraging our existing indicator set.
The analysis in today's article shows how another view of volatility can yield insights into how the market is behaving and give clues as to how it might evolve in the future. At present the clues point to a steady bull market following the 2016 bottom.
Related Articles

There are more than two reasons why NVIDIA’s (NASDAQ:NVDA) stock price can rally another 30% or more in 2025, but the two that underpin the others are data center and automotive...

Stocks fell sharply, with the S&P 500 leading the decline, finishing the day down almost 1.6% at 5,860. Meanwhile, the Nasdaq 100 dropped nearly 2.75%, closing at 20,550. This...

Since the Robotaxi event on October 11th, Tesla (NASDAQ:TSLA) stock is up 38%, currently priced at $291.60 per share This is a return to the early November 2024 price level. But...
Are you sure you want to block %USER_NAME%?
By doing so, you and %USER_NAME% will not be able to see any of each other's Investing.com's posts.
%USER_NAME% was successfully added to your Block List
Since you’ve just unblocked this person, you must wait 48 hours before renewing the block.
I feel that this comment is:
Thank You!
Your report has been sent to our moderators for review


Add a Comment
We encourage you to use comments to engage with other users, share your perspective and ask questions of authors and each other. However, in order to maintain the high level of discourse we’ve all come to value and expect, please keep the following criteria in mind:
Enrich the conversation, don’t trash it.
Stay focused and on track. Only post material that’s relevant to the topic being discussed.
Be respectful. Even negative opinions can be framed positively and diplomatically. Avoid profanity, slander or personal attacks directed at an author or another user. Racism, sexism and other forms of discrimination will not be tolerated.
Perpetrators of spam or abuse will be deleted from the site and prohibited from future registration at Investing.com’s discretion.