


Sign up to create alerts for Instruments,
Economic Events and content by followed authors
Free Sign Up Already have an account? Sign In
Please try another search

Science Applications (NYSE:SAIC) reported mixed results for fourth-quarter fiscal 2020, wherein its earnings topped the Zacks Consensus Estimate but revenues missed the same. The company reported fiscal fourth-quarter adjusted earnings of $1.58 per share, surpassing the consensus mark by 19.7% and improving 35% year over year as well.
Moreover, revenues jumped 29% from the year-ago quarter to $1.54 billion but lagged the Zacks Consensus Estimate of $1.57 billion. Revenues realized from the acquisition of Engility drove the top line. Solid performance of the company’s contract portfolio was a tailwind.
However, adjusting for the impact of acquired revenues, the metric edged down 1.2% due to acquisition-related dis-synergies and completion of a technology contract.
Science Applications International Corporation Price, Consensus and EPS Surprise
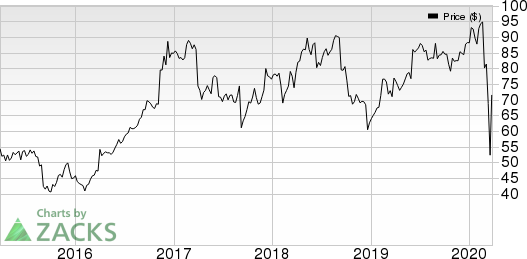
Science Applications International Corporation price-consensus-eps-surprise-chart | Science Applications International Corporation Quote
Quarter in Detail
Net bookings for the fiscal fourth quarter were $2.4 billion, reflecting a book-to-bill ratio of approximately 1.5.
Science Applications’ estimated backlog of signed business deals was $15.3 billion, of which $2.6 billion was funded.
Adjusted operating margin expanded 20 basis points (bps) year over year to 6.8% in the reported quarter.
Adjusted EBITDA of $134 million jumped 41%. Adjusted EBITDA margin expanded 70 bps to 8.7%.
Balance Sheet & Cash Flow
Science Applications ended the fiscal fourth quarter with cash and cash equivalents of $188 million, down from the prior quarter’s $162 million.
Operating cash flow was $69 million, down from the previous quarter’s $116 million. Free cash flow was $62 million compared with $116 million in the fiscal third quarter. During the reported quarter, Science Applications deployed $7 million of capital, $22 million to cash dividends and $16 million to debt repayment.
In fiscal 2020, the company generated operating and free cash flow of $458 million and $437 million, respectively. During this period, Science Applications deployed $21 million of capital, $87 million to cash dividends and $274 million to debt repayment.
Guidance
During the earnings conference call, Science Applications noted that it had intended to provide a formal fiscal 2021 outlook. However, citing the uncertainties due to the coronavirus pandemic, the company has decided to postpone issuing a fiscal 2021 guidance.
Nonetheless, for the investment community, the company shared its thought regarding how it had viewed fiscal 2021 before the crisis. Science Applications said it has witnessed minimal impact of coronavirus on its business.
Prior to the COVID-19 crisis, the company was expecting organic revenue growth in the range of 3% to 6% for fiscal 2021. This would include revenues from the recently-completed acquisition of Unisys Federal.
For the fiscal year, adjusted EBITDA margin is likely to be at the mid-to-upper-end of the 8-9% range.
Free cash flow is expected to be at least $450 million for fiscal 2021.
Zacks Rank & Stocks to Consider
SAIC currently carries a Zacks Rank #3 (Hold).
A few better-ranked stocks in the broader technology sector include Microsoft (NASDAQ:MSFT) , NVIDIA (NASDAQ:NVDA) and Advanced Micro Devices (NASDAQ:AMD) , all carrying a Zacks Rank #2 (Buy), at presently. You can see the complete list of today’s Zacks #1 (Strong Buy) Rank stocks here.
The long-term earnings growth rate for Microsoft, NVIDIA and Advanced MicroDevices is currently estimated at 13%, 14.7% and 22.9%, respectively.
The Hottest Tech Mega-Trend of All
Last year, it generated $24 billion in global revenues. By 2020, it's predicted to blast through the roof to $77.6 billion. Famed investor Mark Cuban says it will produce ""the world's first trillionaires,"" but that should still leave plenty of money for regular investors who make the right trades early.
See Zacks' 3 Best Stocks to Play This Trend >>
The markets have been sluggish this week as investors hope for a jolt later in the week when AI juggernaut NVIDIA Corporation (NASDAQ:NVDA) reports fourth quarter and year-end...
On Friday, a wave of selling pressure swept across the US equity markets, leaving a trail of losses. The S&P 500 closed down 1.7%, the DOW slid 1.69%, and the NASDAQ tumbled a...
Palantir remains highly valued with a 460x P/E ratio and a 42.5x P/B ratio, far above its peers. The stock's beta of 2.81 signals high volatility, meaning sharp moves in both...
Are you sure you want to block %USER_NAME%?
By doing so, you and %USER_NAME% will not be able to see any of each other's Investing.com's posts.
%USER_NAME% was successfully added to your Block List
Since you’ve just unblocked this person, you must wait 48 hours before renewing the block.
I feel that this comment is:
Thank You!
Your report has been sent to our moderators for review
Add a Comment
We encourage you to use comments to engage with other users, share your perspective and ask questions of authors and each other. However, in order to maintain the high level of discourse we’ve all come to value and expect, please keep the following criteria in mind:
Enrich the conversation, don’t trash it.
Stay focused and on track. Only post material that’s relevant to the topic being discussed.
Be respectful. Even negative opinions can be framed positively and diplomatically. Avoid profanity, slander or personal attacks directed at an author or another user. Racism, sexism and other forms of discrimination will not be tolerated.
Perpetrators of spam or abuse will be deleted from the site and prohibited from future registration at Investing.com’s discretion.