


Sign up to create alerts for Instruments,
Economic Events and content by followed authors
Free Sign Up Already have an account? Sign In
Please try another search

Orthofix International N.V. (NASDAQ:OFIX) reported fourth-quarter 2017 adjusted earnings per share (EPS) of 52 cents from continuing operations. The figure is ahead of the Zacks Consensus Estimate by a couple of cents. Adjusted earnings improved 23.8% year over year, primarily on strong sales growth at the company’s Biologics and Spine Fixation strategic business units (SBU).
Excluding one-time items, net income from continuing operations in the fourth quarter came in at 8 cents per share, showing a remarkable year-over-year improvement over the net loss from continuing operations of 29 cents.
Sales Details
Orthofix’s fourth-quarter sales improved 7.7% (6.1% at constant exchange rate or CER) to $116.9 million. The figure also beat the Zacks Consensus Estimate of $112 million by 4.4%.
Sales were primarily driven by a better-than-expected performance by the company’s all four SBUs with significant contributions from Biologics and Spine Fixation.
SBU Details
For the fourth quarter, the company posted BioStim sales of $49.8 million, reflecting 4.1% (same at CER) growth from the prior-year period. Biologics SBU sales totaled $16.9 million, up 10.7% (same at CER) from the year-ago quarter. This upside resulted from strong sales of Trinity Elite allograft, banking on an expanded distributor network.
Extremity Fixation sales were $29.1 million in the quarter under review, showing an 8.4% improvement (up 2.2% at CER) from fourth-quarter 2016. The company particularly realized strong revenue growth from the outside U.S. Extremity Fixation's stocking distribution.
Orthofix International N.V. Price, Consensus and EPS Surprise
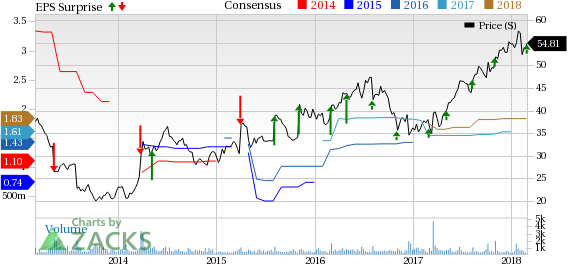
Orthofix International N.V. Price, Consensus and EPS Surprise | Orthofix International N.V. Quote
Orthofix reported Spine Fixation SBU sales of $21.2 million, reflecting 13.5% (up 13.2% at CER) growth over the year-earlier quarter. This uptick can be attributed to new product launches and the adopted strategic initiatives.
Margins
In the fourth quarter, gross margin expanded 133 basis points (bps) to 79.8%. Solid top-line growth can be a major factor to have boosted the gross margin.
Sales and marketing expenses rose 6.5% year over year to $51.9 million. General and Administrative expenses were down 7.5% to $19.5 million, led by lower legal settlement costs in the reported period as well as core expense reductions due to the U.S. and outside U.S. restructuring initiatives and lower professional fees. The company also witnessed a 12.6% rise in research and development expenses to $8.5 million. Accordingly, adjusted operating margin expanded 426 bps to 11.6% owing to increased operating expenses.
Cash Position
Orthofix exited 2017 with cash and cash equivalents of $81.2 million compared with $39.6 million at the end of 2016. Full-year net cash provided by operating activities was $53.3 million compared with $44.7 million a year ago. Excluding capital expenditure of $16.9 million, free cash flow was $36.4 million in 2017. This compares unfavorably with the free cash flow of $26.4 million in 2018 due to capex of $18.3 million.
2018 Guidance
Orthofix has provided its 2018 guidance. Full-year 2018 sales are expected in the band of $450-$455 million. The Zacks Consensus Estimate for full-year revenues is pegged at $453.9 million, higher than the guided range.
Adjusted EPS from continuing operations are expected in the range of $1.76-$1.84. The Zacks Consensus Estimate for full-year adjusted EPS stands at $1.83, within but close to the upper end of the company’s projected range.
Our Take
The company exited the fourth quarter of 2017 on a solid note with both earnings and sales beating the Zacks Consensus Estimate. The top line was substantially driven by strength in Biologics and Spine Fixation businesses, expected to continue on the back of an improved performance by sales partners, expanded distributorship network and introduction of products.
The year 2017 has remained successful for Orthofix. This is because the company transformed its spine fixation SBU, delivering exceptional growth and sales momentum in addition to a robust stream of new products in the period. In 2018, the company has already launched 20 products and has even scheduled another 17 to be released ahead.A strong current-year guidance is indicative of its enhanced prospects.
On the flip side, currency fluctuations, a competitive landscape and macroeconomic headwinds continue to pose challenges to the company. Moreover, higher operating expenses are a matter of concern for Orthofix. Also, heavy dependence on a third party for final distribution of products exposes the company to increased risks.
Zacks Rank & Key Picks
Orthofix carries a Zacks Rank #3 (Hold). Some better-ranked stocks in the broader medical space are athenahealth Inc. (NASDAQ:ATHN) , Express Scripts Holding Company (NASDAQ:ESRX) and Bioverativ Inc. (NASDAQ:BIVV) , each sporting a Zacks Rank #1 (Strong Buy). You can see the complete list of today’s Zacks #1 Rank stocks here.
athenahealth has an expected long-term growth rate of 20.7%. In the past three months, the stock has gained 8%.
Express Scripts has a projected long-term growth rate of 10%. In the past six months, the stock has returned 25.9%.
Bioverativ has an expected long-term growth rate of 14%. In the past six months, the stock has soared 85.5%.
Zacks Top 10 Stocks for 2018
In addition to the stocks discussed above, would you like to know about our 10 finest buy-and-hold tickers for the entirety of 2018?
Last year's 2017 Zacks Top 10 Stocks portfolio produced double-digit winners, including FMC Corp (NYSE:FMC). and VMware which racked up stellar gains of +67.9% and +61%. Now a brand-new portfolio has been handpicked from over 4,000 companies covered by the Zacks Rank. Don’t miss your chance to get in on these long-term buys.
Access Zacks Top 10 Stocks for 2018 today >>
The markets have been sluggish this week as investors hope for a jolt later in the week when AI juggernaut NVIDIA Corporation (NASDAQ:NVDA) reports fourth quarter and year-end...
On Friday, a wave of selling pressure swept across the US equity markets, leaving a trail of losses. The S&P 500 closed down 1.7%, the DOW slid 1.69%, and the NASDAQ tumbled a...
Palantir remains highly valued with a 460x P/E ratio and a 42.5x P/B ratio, far above its peers. The stock's beta of 2.81 signals high volatility, meaning sharp moves in both...
Are you sure you want to block %USER_NAME%?
By doing so, you and %USER_NAME% will not be able to see any of each other's Investing.com's posts.
%USER_NAME% was successfully added to your Block List
Since you’ve just unblocked this person, you must wait 48 hours before renewing the block.
I feel that this comment is:
Thank You!
Your report has been sent to our moderators for review
Add a Comment
We encourage you to use comments to engage with other users, share your perspective and ask questions of authors and each other. However, in order to maintain the high level of discourse we’ve all come to value and expect, please keep the following criteria in mind:
Enrich the conversation, don’t trash it.
Stay focused and on track. Only post material that’s relevant to the topic being discussed.
Be respectful. Even negative opinions can be framed positively and diplomatically. Avoid profanity, slander or personal attacks directed at an author or another user. Racism, sexism and other forms of discrimination will not be tolerated.
Perpetrators of spam or abuse will be deleted from the site and prohibited from future registration at Investing.com’s discretion.