- All Instrument Types
- Indices
- Equities
- ETFs
- Funds
- Commodities
- Currencies
- Crypto
- Bonds
- Certificates
Please try another search

Options Bears Blast Sinking Semiconductor ETF

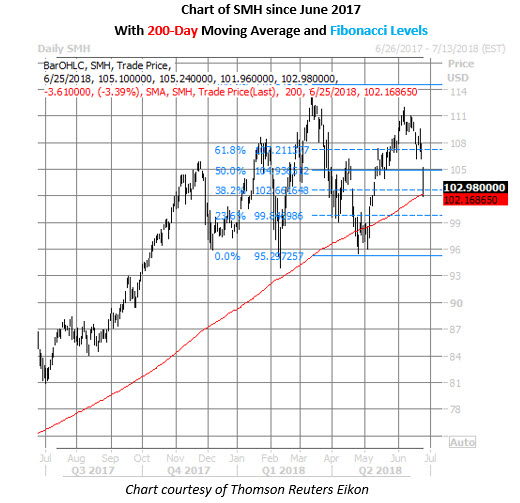
The tech sector is feeling the brunt of the latest trade worries weighing on Wall Street, with the Nasdaq on track for its worst daily loss since April 2. Chip stocks are getting hit especially hard, and the VanEck Vectors Semiconductor (NYSE:SMH) is down 3.4% at $102.98. Options bears are targeting even bigger losses, too, with puts trading at a quick clip today.
At last check, around 100,000 puts and 40,000 calls have changed hands on SMH -- three times what's typically seen at this point in the day, and volume pacing in the 98th annual percentile. Seeing notable attention is the weekly 6/29 95-strike put, where it looks like new positions are being purchased for a volume-weighted average price of $0.16, making breakeven at this Friday's close $94.84 (strike less premium paid).
Today's activity reflects the put-skewed bias seen among short-term options traders, as evidenced by SMH's top-heavy gamma-weighted Schaeffer's put/call open interest ratio (SOIR) of 2.76. In other words, near-the-money puts more than double calls among options set to expire in three months or less.
Drilling down, the August 90 and 100 puts saw the biggest increase in open interest over the past 10 days, and it looks like these back-month options were possibly used to initiate a long put spread back on Friday, June 15. If this was the case, the trader expects the exchange-traded fund to keep falling through August options expiration, but lowered their risk -- and set a floor -- by selling the 90-strike put.
Looking at the charts, SMH shares have not closed below $90 since last September. The shares have been choppy in 2018, and are up 5.8% year-to-date. Nevertheless, the fund's 200-day moving average has emerged as support -- containing an early May pullback, and containing today's sell-off. Plus, this trendline is currently located near $102.20, which is in the vicinity of a 38.2% Fibonacci retracement of SMH's March through April decline.

Related Articles

While market cap weighting is still the go-to for many investors due to its low cost and low turnover, it's becoming increasingly fragile these days thanks to the concentration...

The oldest ETF, the SPDR S&P 500 Trust, had the most inflows in February. The $14.6 billion in inflows allowed it to surpass the Vanguard S&P 500 ETF. Which ETFs saw the...

Leveraged exchange-traded funds (ETFs) substantially increase the potential reward of an investment by affording investors the chance to generate double or triple the returns of...
Are you sure you want to block %USER_NAME%?
By doing so, you and %USER_NAME% will not be able to see any of each other's Investing.com's posts.
%USER_NAME% was successfully added to your Block List
Since you’ve just unblocked this person, you must wait 48 hours before renewing the block.
I feel that this comment is:
Thank You!
Your report has been sent to our moderators for review


Add a Comment
We encourage you to use comments to engage with other users, share your perspective and ask questions of authors and each other. However, in order to maintain the high level of discourse we’ve all come to value and expect, please keep the following criteria in mind:
Enrich the conversation, don’t trash it.
Stay focused and on track. Only post material that’s relevant to the topic being discussed.
Be respectful. Even negative opinions can be framed positively and diplomatically. Avoid profanity, slander or personal attacks directed at an author or another user. Racism, sexism and other forms of discrimination will not be tolerated.
Perpetrators of spam or abuse will be deleted from the site and prohibited from future registration at Investing.com’s discretion.