We know the world economic pattern we have been used to in years past–world population grows, resource usage grows (including energy resources), and debt increases. The economy grows fast enough that paying an interest rate a little higher than the inflation rate “works” for both lenders and borrowers. Borrowers are able to handle the required interest rate, because their wages are rising fast enough to buy homes and cars at prevailing interest rates. Unemployment is not too much of a problem because jobs grow with population and resource usage. Governments do fairly well, too, because they can tax the growing wages of the population sufficiently to get enough taxes to pay the benefits they have promised to constituents.
This model “works” fairly well, as long as the economy is growing fast enough–population continues to grow and resource extraction continues to grow as planned. In a finite world, we know that this model cannot work forever. At some point, we can expect to start reaching limits.
What do these limits look like? I would argue that in the case of resource extraction, these limits look like increasingly high cost of extraction. We need to extract resources from increasingly deep locations, in increasingly out-of-the way places, using increasingly more energy intensive techniques. For a while, improved technology is sufficient to keep costs down, but eventually the cost of extraction begins to rise. Some of the rising cost may even be taxes, because the country where the extraction is located needs higher taxes to keep a growing population properly fed and housed, so they do not rebel and disrupt production.
When the cost of extraction begins to rise, it is as if we are pouring more manpower and more resources of many types (steel, fracking fluid, jet fuel, electricity, diesel fuel) into a deep pit, never to be used again. When we put more resources in, we get the same amount of resource out, or even less than in the past. If we want to continue to increase the amount we extract, we have to further increase the quantity of resources used in extraction. I have referred to this issue as the Investment Sinkhole problem. Obviously, if we put more manpower and other resources into this pit, we have less for other purposes.
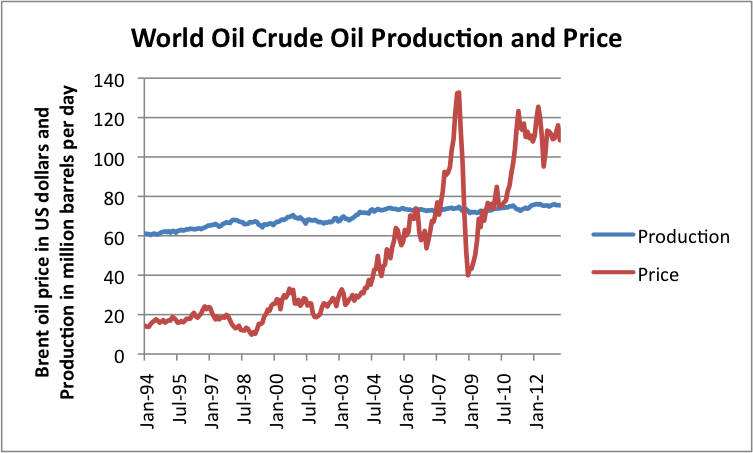
A recent example of resources hitting limits is oil. World oil prices started increasing about 2004 (Figure 1). Analysts say that these rising prices are related to rapidly increasing production costs. Oil company presidents say that we extracted the cheap to extract oil first,
and most of it is now gone. Recent reports of major oil companies say profits are dropping, despite high oil prices.
world-crude-oil-production-and-price
Figure 1. World crude oil production and Brent spot oil price, both based on EIA data.
Oil is an important commodity because it represents about 33% of the world’s energy supply. It is the world’s primary transportation fuel. It is a very important fuel in agriculture, operating farm equipment, transporting fertilizer, running diesel irrigation pumps, making herbicides and pesticides, and transporting goods to market. Therefore, if oil prices rise, food prices are likely to rise well. In fact, since nearly all goods are transported, an oil price rise affects nearly all goods and quite a few services.
There are really two issues when the cost of oil extraction rises:
1. If the sales price of oil rises, to what extent will this increase adversely affect the economic growth oil importing economies? Rising oil prices mean that the salaries of workers do not go as far, so they must cut back on discretionary goods. Profits of companies will also fall, because it is hard to raise prices of goods, without reducing the quantity sold. In my view, the run-up in oil prices since 2004 explains pretty much all of the “Great Recession’s” impact on oil importing economies. In the next section, I show evidence that oil price increases have had a very adverse impact on GDP growth of oil importers.
2. While the cost of oil extraction is expected to continue to rise, can the sales price of oil really increase to match this higher extraction cost? If oil price can’t rise because of affordability issues (low salary growth, low growth in debt, or cutbacks in government transfer payments), then there is likely to be a crisis of a different kind. Oil exporters will find that oil prices are not high enough to cover their costs, and will cut back drilling to what is profitable. In fact, countries that are producing oil mostly for themselves, such as the US, are also likely to see their oil production drop, because prices will not be high enough to justify new investment. In such a situation, both oil importers and oil exporters are much worse off, because most of our systems are dependent on oil, and less oil will be available.
The Federal Reserve now is discussing the possibility of stopping
quantitative easing. If this is done, I expect it will have a very adverse economic effect: long-term interest rates will rise and asset prices are likely to fall. If commodity prices fall as well, then we could find ourselves in the scenario outlined in the preceding paragraph, in which oil prices drop lower than the cost of production for many producers.
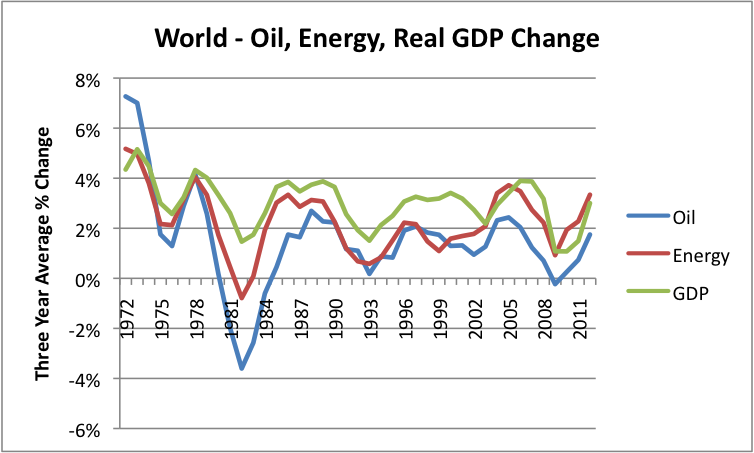
Relationship between Oil Consumption Growth and GDP Growth If we look at a history of growth in energy consumption and world economic growth, it is clear that energy growth, and for that matter oil growth, tend to move together.
world-oil-energy-real-gdp-change
Figure 2. Growth in world GDP, compared to growth in world of oil consumption and energy consumption, based on 3 year averages. Data from BP 2013 Statistical Review of World Energy and
USDA compilation of World Real GDP.
In fact, agencies such as the International Energy Agency use projected GDP growth in estimating future demand for energy products, including oil. Energy supplies don’t grow quite as rapidly as GDP, partly because of efficiency gains, and partly because the world economy is becoming more service oriented. In general, new services don’t require as much energy as new manufacturing.
Growth in oil usage would also be expected to mirror GDP growth, but at a slightly lower rate of increase than growth of energy use in general. This is the case because oil is the most expensive of the major energy products. Consequently, there is a strong incentive to switch to cheaper energy products or to increase efficiency.
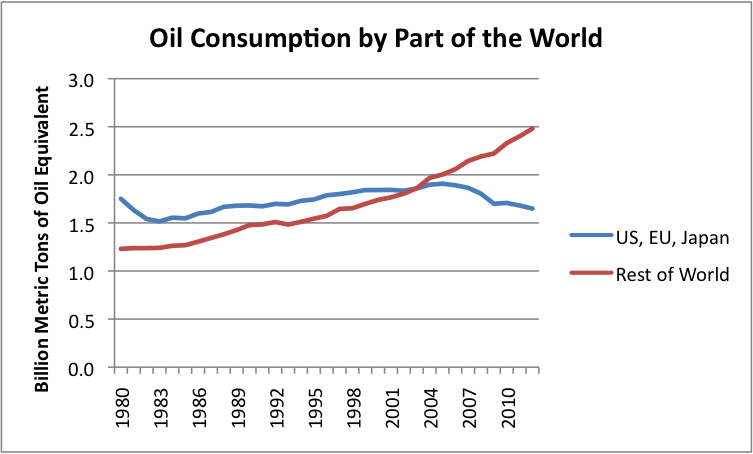
Effect of High Oil Prices on GDP of Oil Importers If we look at the data, it is striking how handicapping high oil prices are to oil-importing countries (Figure 3). Consumption by countries that have historically been the biggest importers of oil, (US, EU-27, and Japan) started dropping about same time oil prices were started to rise.
oil-consumption-by-part-of-the-world
Oil consumption by part of the world, based on BP’s 2013 Statistical Review of World Energy.
At least part of the reason for this drop is because oil is an expensive energy product. With the run-up in prices, goods made using oil products became increasingly high cost to make and transport. With these higher costs, goods became less affordable to the country’s own citizens as well as less competitive in the world marketplace.
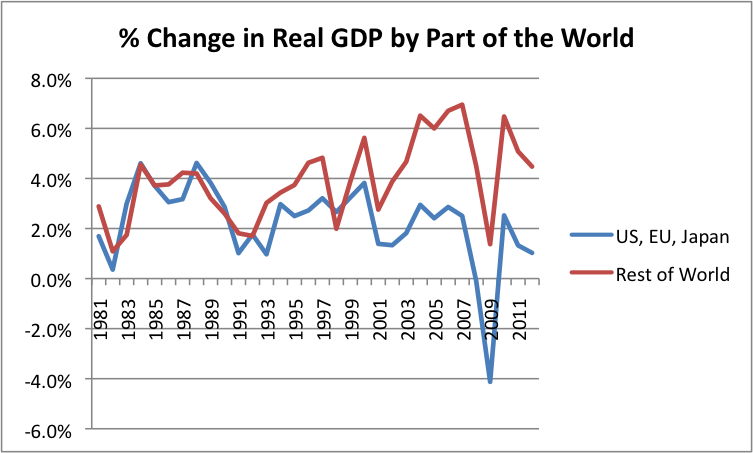
During the same period, annual growth in inflation adjusted (“real”) GDP for the EU, US, and Japan combined dropped significantly below the rest of the world (Figure 4, below).
percent-change-in-real-gdp-by-part-of-the-world
Figure 4. Annual percent change in Real GDP by part of the world, based data of the USDA.
In fact, if we look at groupings of countries as shown in Figures 5 – 7, we can see a dose-related response, with countries deriving the highest percentages of their energy consumption from oil having the poorest economic results.
Figure 5 shows the percentage of energy consumption coming from oil in 2004, for several country groupings. (2004 is about the time that the oil price run-up started.) Figure 5 indicates the PIIGS1 and Japan had the highest percentage of their energy supply from oil, and China had the lowest percentage. The US, the EU-27 minus PIIGS, and India were in between.
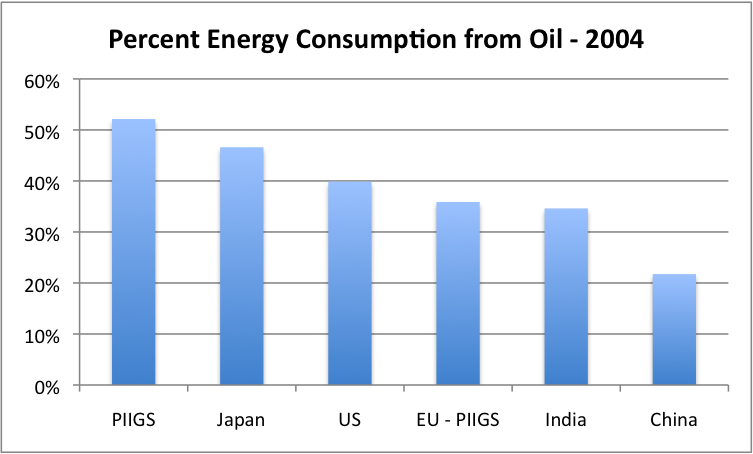
percent-energy-consumption-from-oil-2004
Figure 5. Percent energy consumption from oil in 2004, for selected countries and country groups, based on BP 2013 Statistical Review of World Energy. (EU – PIIGS means “EU-27 minus PIIGS’)
We can also look at economic growth for the same groups of countries. The countries with the lowest proportion of oil use, and thus least affected by the run-up in oil costs since 2004, have had the greatest GDP growth in the 2005 to 2011 period. In fact, the GDP growth percentages for the period 2005-2011 (shown in Figure 6 below) follow exactly the reverse pattern shown in Figure 4.
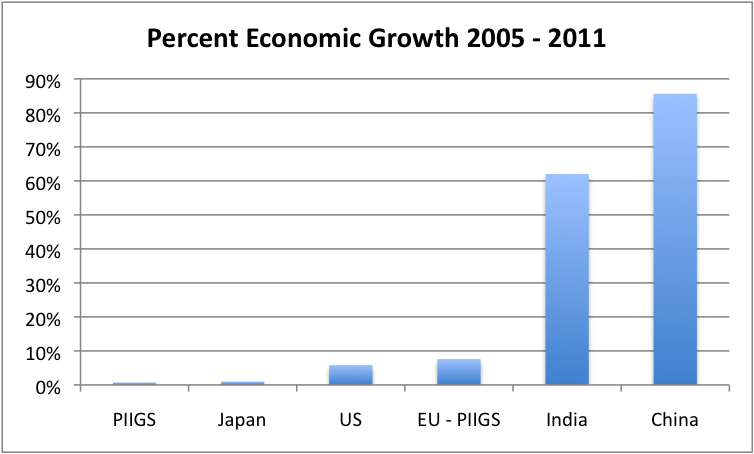
percent-economic-growth-2005-2011
Figure 6. Percent growth in real GDP between 2005 and 2011, based on USDA GDP data in 2005 US$.
In Figure 6, part of the high growth in India and China relates to increased globalization. Countries around the world compete on wage and benefit levels as well as on the price of energy. China and India have lower wages than the developed countries, so could increase their share of manufacturing for this reason as well. More liberal treatment of pollution control may also be a factor in their increases.
Not too surprisingly, growth in oil usage follows the pattern of economic growth (Figure 7, below).

percent-oil-consumption-growth-2004-to-2011
Figure 7. Percent consumption growth between 2004 and 2011, based on BP’s 2013 Statistical Review of World Energy.
It should be noted, too, that for the PIIGS, it is not just one large country with a high percentage of oil consumption in 2004 that is dominating the group result in Figure 5.
All of the PIIGS had high oil consumption percentages in 2004: Greece, 62%; Portugal, 61%; Ireland, 61%; Spain, 52%; Italy, 49%. In fact, the country with the worst problems (Greece) had the highest oil consumption percentage in 2004.
I might also mention that economist
James Hamilton found that 10 out of 11 United States recessions since World War II were associated with oil price spikes of 25% or more.
What Goes Wrong in the Expected Model, When Oil Prices Remain High? In the first paragraph of this post, I outlined an expected model of how the world might operate, if economic growth remains high. Slower economic growth would be expected, if resource limits start having an impact on economic growth.
What happens if oil prices remain high? I think the answers is fairly different for businesses, compared to consumers. Businesses can mostly shake off the impact of higher oil prices, by cutting back on the amount produced (and thus cutting the number employed), or by shipping production to a lower cost part of the world (again cutting back the number of US workers employed), but
workers don’t have the benefit of making changes of these types. They can drop out of the workforce and apply for government benefits, but this does not really fix their lack of jobs, and the low growth in wages for those who do have jobs.
Because wages of workers are still adversely affected, even years after an oil price rise, and because the cost of goods now reflects the higher price of oil, consumers continue to find that their budgets are stretched. Some can afford to purchase a higher-mileage automobile, but most cannot–their budgets are still stretched, and some have dropped out of the work-force completely. The government can try to cover up this situation with artificially low interest rates for homes and cars, and with higher transfer payments using deficit spending. Unfortunately, the government programs don’t really fix the underlying problem, namely a lower percentage of the population with jobs, and wages of those with jobs not rebounding by much. Because there is no real fix for the underlying problem, the economy doesn’t really bounce back.
Quantitative Easing, and the Unwinding of Quantitative Easing One way the government hides our current financial problems is with quantitative easing (QE). QE lowers longer-term interest rates, such as those that affect the price of mortgages. QE also lowers the interest rate the government pays on its own debt, helping to government to have closer to a balanced budget. The lower interest rates tend to increase stock market prices, and to raise prices of homes2 and farms, because investors seek investments that provide better yields than the absurdly low rates available on bonds. This doesn’t really fix the underlying problem, either.
The government can also try to induce banks to lend more money out, but if buyers don’t have high-paying jobs, it becomes increasingly difficult to actually get the money available for lending into the hands of potential buyers. Waiting for several years doesn’t really fix the situation either–the accumulated deficit just gets worse, and the bubbles blown by QE become larger. None of this fixes the underlying problem of high oil prices.
If the government tries to back off from QE, we will see longer term interest rates rise. This will make mortgage rates rise, and cut back on the number of buyers of homes. Rising interest rates are likely to bring back the problem of falling home prices, and reduce the number of new homes built. Car sales may also fall, as interest rates on loans for new cars rise.
The suddenly higher interest rates are likely to make the stock market fall, because with higher yields, bonds will become more attractive investments in comparison to stocks. As interest rates rise, the value of bonds can be expected to drop as well, because this is the way bonds are priced–the higher the available interest rate, the lower the resale price of the bond.
The declining values of stocks and bonds, and for that matter, houses, is likely to be a problem for citizens, because they will realize that their savings are worth less. The “wealth effect” will work backwards. People will realize that they are poorer than they were before, and spend less.
The decline in the value of stocks and bonds is likely to be a problem for banks, pension plans, and insurers–and for that matter, any kind of institution holding large amounts of stocks and bonds. The exact impact will depend on the accounting rules for the particular institution. If market value is used for stocks and bonds, institutions holding them will show large capital losses, perhaps putting them below regulatory limits.
Part of the capital losses may be covered up by special accounting rules, such as allowing bonds to be valued at amortized cost rather than market value. But there may still be an adverse impact on capital, possibly putting some institutions below regulatory limits. Also, if an institution needs to sell a bond or stock that is valued on its balance sheet for more than it is really worth, it will incur a loss.
The removal of QE will also mean that the interest rates the government pays on its own debt will rise. This is will push up needed tax rates, putting further pressure on the consumer.
With lower asset values and higher tax rates, debt defaults are likely to become more of a problem again. Banks may cut back in lending as well, especially if their capital ratios fall too low.
The Effect on Oil Prices With values of most investments dropping lower and tax rates rising, my concern is that the sales price of oil will drop lower, causing a severe cutback in world oil production. This issue is really one of
affordability of oil. Economists would call this inadequate “demand” for oil. Of course, people will still need to eat food and need oil for commuting, but this doesn’t come into economists’ definition of demand–demand is only how much people can
afford, not what they
need.
So we really are in a quandary.
If oil prices stay high, recessionary effects can expect to continue for oil importers. In addition, China, India, and other developing countries are increasingly becoming oil importers, so they themselves can increasingly expect to be affected by high oil prices. Furthermore, these same countries find demand for their manufactured goods is reduced because of economic problems of the Eurozone, Japan, and possibly the US.
If oil prices drop, they will be too low for oil companies
to make new high-cost investments. A drop in oil production will take place gradually, as existing wells continue to produce, but new ones are not added. The impact of this lower oil production may be quite severe. The collapse of the Former Soviet Union in 1991 seems to have been caused by too low oil prices. All countries are likely to be affected by this drop in production–importers because the lack of availability of oil for import, and exporters because of the lack of revenue from oil exports.
Even if we sail through our current set of problems, we can count on meeting them again in a few years, because the cost of oil extraction can be expected to keep increasing. If oil prices rise again, oil importers are likely to see a large increase in unemployment, and a squeeze on profit margins of businesses. Banks may again fail. Government will face a new round of problems, similar to those in 2008, or even worse, without having fixed their previous set of problems.
Notes: [1] Acronym for Portugal, Italy, Ireland, Greece, and Spain, the countries in Europe with the most financial problems in the past few years.
[2] Many of the buyers for houses are institutional investors, planning to rent the houses out.


Add a Comment
We encourage you to use comments to engage with other users, share your perspective and ask questions of authors and each other. However, in order to maintain the high level of discourse we’ve all come to value and expect, please keep the following criteria in mind:
Enrich the conversation, don’t trash it.
Stay focused and on track. Only post material that’s relevant to the topic being discussed.
Be respectful. Even negative opinions can be framed positively and diplomatically. Avoid profanity, slander or personal attacks directed at an author or another user. Racism, sexism and other forms of discrimination will not be tolerated.
Perpetrators of spam or abuse will be deleted from the site and prohibited from future registration at Investing.com’s discretion.