


Sign up to create alerts for Instruments,
Economic Events and content by followed authors
Free Sign Up Already have an account? Sign In
Please try another search

Nordstrom, Inc. (NYSE:JWN) reported dismal fourth-quarter fiscal 2019 results, wherein sales and earnings missed the Zacks Consensus Estimate. Notably, the company’s bottom line missed estimates after surpassing the consensus mark in the last two quarters. Also, earnings declined on a year-over-year basis. Management provided guidance for fiscal 2020.
Backed by the dismal quarterly results, shares of the Seattle, WA-based company decreased 7.2% in the after-market trading session on Mar 3. In the past three months, this Zacks Rank #3 (Hold) stock has decreased 11.3% compared with the industry’s decline of 9.8%.
Q4 Highlights
Nordstrom’s earnings of $1.42 per share missed the Zacks Consensus Estimate of $1.48 and declined 4.1% on a year-over-year basis. This downside was due to increase in SG&A expenses and higher interest expenses.
Nordstrom, Inc. Price, Consensus and EPS Surprise
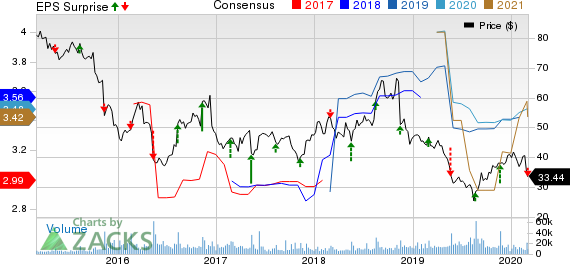 Nordstrom, Inc. Price, Consensus and EPS Surprise
Nordstrom, Inc. price-consensus-eps-surprise-chart | Nordstrom, Inc. Quote
Total revenues rose 1.3% to $4,538 million but missed the Zacks Consensus Estimate of $4,568 million. The company witnessed improved top-line trends in its full-price and off-price businesses, driven by gains from loyalty program, digital channel and merchandise assortment. The company’s net Retail sales grew 1.3% to $4,439 million, while Credit Card net revenues declined 2% to $99 million.
Furthermore, Nordstrom’s full-price net sales (including the U.S. full-line stores, Nordstrom.com, the Canadian operation, Trunk Club, Jeffrey and Nordstrom Local) increased 1% to $3,015 million in the fiscal fourth quarter. The company’s off-price net sales (including Nordstrom U.S. Rack stores, Nordstromrack.com/HauteLook and Last Chance clearance stores) grew 1.8% to $1,424 million.
Meanwhile, digital sales advanced 9% in the reported quarter. This represents 35% of the company’s business, up 200 basis points (bps) year over year. The company benefited from online order pickup, which contributed more than half of digital sales growth in full-price stores.
Nordstrom also continued to expand its loyalty program in the fiscal fourth quarter, as the Nordy Club had about 13 million active customers, contributing about two-thirds of its sales in 2019.
Operational Update
Nordstrom's gross profit margin contracted 9 bps to 35%. This downside was due to higher costs from expansion of the loyalty program and planned occupancy costs related to the NYC flagship store, partly offset by improved merchandise margins. Ending inventory declined 2.9% from last year, marking four repeated quarters of sales growing faster than inventory.
Selling, general and administrative (SG&A) expenses, as a percentage of sales, grew 70 bps to 30.5%. Excluding integration charges, expenses remained flat due to realized expense savings of about $55 million from ongoing productivity initiatives.
Further, earnings before interest and taxes (EBIT), as a percentage of net sales contracted 90 bps to 6.7%. Excluding integration charges of $32 million, EBIT margin declined slightly compared to prior year.
Store Update
As of Feb 1, 2020, Nordstrom operated 380 stores across 40 states. These include 116 full-line stores in the United States, Canada and Puerto Rico, 248 Nordstrom Rack outlets, three Jeffrey boutiques, two clearance stores, six Trunk Club clubhouses as well as five Nordstrom Local service concepts.
Other Financials
Nordstrom ended fiscal 2019 with cash and cash equivalents of $853 million, long-term debt (net of current liabilities) of $2,676 million and total shareholders’ equity of $979 million.
Nordstrom generated $1,236 million of net cash from operating activities and spent $935 million as capital expenditures in fiscal 2019. At the end of fiscal 2019, it had free cash flow of $309 million.
Moreover, the company bought back 4.1 million shares for $186 million in fiscal 2019. It had authorization worth of nearly $707 million remaining to be repurchased under the current program. Additionally, it paid out cash dividends worth $229 million in the same time frame. Moreover, it declared a quarterly cash dividend of 37 cents per share. This will be payable on Mar 25, 2020, to its shareholders of record as on Mar 10.
Other Strategies
Nordstrom’s market strategy leverages physical and digital assets to offer customers a greater selection of merchandise available next-day and more convenient access to services. In 2019, the company enhanced its strategy to five top markets — New York, Los Angeles, Chicago, Dallas and San Francisco. This resulted in outsized customer engagement and a lift in sales trends of 80 basis points relative to other markets in the fiscal fourth quarter.
Further, the company plans to expand its market strategy through several key initiatives, which include expanding to five additional markets. Also, the company plans to launch e-commerce in Canada to enable a seamless shopping experience across stores and online. Moreover, it has been receiving strong customer response for its NYC flagship store.
FY20 Guidance
Management provided guidance for fiscal 2020, which does not include the impacts of coronavirus outbreak. Nordstrom projects net sales to increase in the range of 1.5-2.5%. Credit card revenues, net, are expected to grow in mid single digit.
Further, the company expects EBIT of $815-$855 million, with EBIT margin of 5.3-5.5%. Nordstrom envisions earnings per share of $3.25-$3.50 for fiscal 2020. The Zacks Consensus Estimate for fiscal 2020 is pegged at $3.48.
3 Stocks to Consider
Rocky Brands, Inc. (NASDAQ:RCKY) delivered positive earnings surprise of 13%, on average, in the trailing four quarters. It currently sports a Zacks Rank #1 (Strong Buy).You can see the complete list of today’s Zacks #1 Rank stocks here.
Zumiez Inc. (NASDAQ:ZUMZ) has a long-term earnings growth rate of 12% and carries a Zacks Rank #1.
Stitch Fix, Inc. (NASDAQ:SFIX) has a long-term earnings growth rate of 15% and a Zacks Rank #1.
Today's Best Stocks from Zacks
Would you like to see the updated picks from our best market-beating strategies? From 2017 through 2019, while the S&P 500 gained and impressive +53.6%, five of our strategies returned +65.8%, +97.1%, +118.0%, +175.7% and even +186.7%.
This outperformance has not just been a recent phenomenon. From 2000 – 2019, while the S&P averaged +6.0% per year, our top strategies averaged up to +54.7% per year.
See their latest picks free >>
Through many years of frustration among gold bugs due to the failure of gold stock prices to leverage the gold prices in a positive way, there were very clear reasons for that...
I know there is the smell of fear in the air when I see my readership double as we reach a point where weekly chart factors come into play. Up until last week, markets have...
• Trump’s trade war, inflation data, and last batch of earnings will be in focus this week. • DoorDash’s imminent inclusion in the S&P 500 is likely to trigger a wave of...
Are you sure you want to block %USER_NAME%?
By doing so, you and %USER_NAME% will not be able to see any of each other's Investing.com's posts.
%USER_NAME% was successfully added to your Block List
Since you’ve just unblocked this person, you must wait 48 hours before renewing the block.
I feel that this comment is:
Thank You!
Your report has been sent to our moderators for review
Add a Comment
We encourage you to use comments to engage with other users, share your perspective and ask questions of authors and each other. However, in order to maintain the high level of discourse we’ve all come to value and expect, please keep the following criteria in mind:
Enrich the conversation, don’t trash it.
Stay focused and on track. Only post material that’s relevant to the topic being discussed.
Be respectful. Even negative opinions can be framed positively and diplomatically. Avoid profanity, slander or personal attacks directed at an author or another user. Racism, sexism and other forms of discrimination will not be tolerated.
Perpetrators of spam or abuse will be deleted from the site and prohibited from future registration at Investing.com’s discretion.