


Sign up to create alerts for Instruments,
Economic Events and content by followed authors
Free Sign Up Already have an account? Sign In
Please try another search

A month has gone by since the last earnings report for Mondelez International, Inc. (NASDAQ:MDLZ) . Shares have lost about 4.9% in the past month, outperforming the market.
Will the recent negative trend continue leading up to its next earnings release, or is MDLZ due for a breakout? Before we dive into how investors and analysts have reacted as of late, let's take a quick look at the most recent earnings report in order to get a better handle on the important drivers.
Fourh Quarter 2017 Results
Mondelez reported fourth-quarter 2017 results, wherein earnings surpassed the Zacks Consensus Estimate and revenues came in line with the consensus mark. Adjusted earnings of 57 cents per share beat the Zacks Consensus Estimate of 56 cents. Adjusted earnings grew 21%, primarily driven by operating gains.
Sales Details
Net revenues increased 2.9% year over year to $6,966 million courtesy of the Power Brands and favorable trends in emerging markets. Emerging markets’ net revenues rose 6.3%, while Power Brands witnessed a 3.7% increase in revenues.
Regionally, Latin America, Asia, Middle East & Africa and Europe registered an increase of 4.2%, 2.6% and 5% in revenues, respectively. However, North America’s revenues declined 0.6%.
Reported total revenues missed the Zacks Consensus Estimate of $6,973 million, meagerly.
Organic revenues increased 2.4%, softer than 2.8% in the last quarter. The improvement was primarily driven by Power Brands as well as strong performance in Latin America and Asia, Middle East & Africa.
Pricing increased 2.1 percentage points (pp), more than 1.5 pp in the previous quarter. Volume/Mix had a positive impact of 0.3 pp to the revenues. In the prior quarter, it was 1.3 pp in the last quarter.
Margins
Adjusted gross margin was 39.2%, which remained unchanged from the year-ago level. Higher input costs and unfavorable mix were offset by continued net productivity gains and higher pricing.
However, adjusted operating margin expanded 180 basis points (bps) year over year to 15.9% on the back of lower overhead costs owing to continued cost reduction.
Financials
Mondelez reported cash and cash equivalents of $761 million as on Dec 31, 2017, down from $1.74 billion at the end of 2016.
The company repurchased approximately $400 million of its common stock and paid approximately $300 million in cash dividends. In 2017, Mondelez returned $3.4 billion of capital to shareholders through share repurchases and dividends. Moreover, the company has given a boost to its share repurchase authorization by $6 billion to $19.7 billion from $13.7 billion, extending the expiration date of the program to Dec 31, 2020.
2017 Highlights
Full-year net revenues came in at $25.9 billion, decreasing 0.1% from 2016 level. Organically, net revenues grew 0.9%, which includes a negative impact of approximately 40 bps from the June 2017 malware incident.
Adjusted earnings were $2.14 per share, an increase of 15% year over year, driven by operating efficiencies, lower interest expense and lower shares outstanding.
2018 Guidance
Organic net revenues are expected to increase between 1% and 2%. Adjusted operating margin is expected to be 17%.
Management expects adjusted earnings to grow by double-digit on a constant currency basis. The company expects currency translation to increase net revenue growth by approximately 4% and adjusted EPS by approximately 12.3 cents.
Also, management commented on Keurig's deal to buy soda maker Dr Pepper Snapple. Mondelez had a stake in Keurig before the deal and will now have a 13% to 14% stake in the new company, Keurig Dr Pepper, when the transaction closes next quarter.
How Have Estimates Been Moving Since Then?
In the past month, investors have witnessed an upward trend in fresh estimates. There have been four revisions higher for the current quarter.
Mondelez International, Inc. Price and Consensus
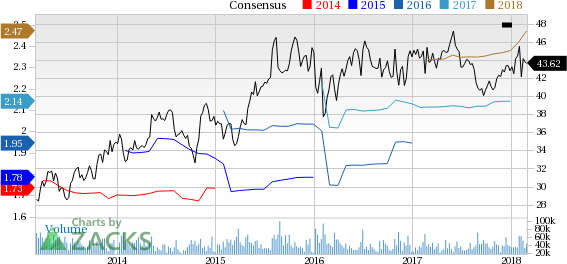
Mondelez International, Inc. Price and Consensus | Mondelez International, Inc. Quote
VGM Scores
At this time, MDLZ has an average Growth Score of C, a grade with the same score on the momentum front. Following the exact same course, the stock was allocated a grade of C on the value side, putting it in the middle 20% for this investment strategy.
Overall, the stock has an aggregate VGM Score of C. If you aren't focused on one strategy, this score is the one you should be interested in.
Based on our scores, the stock is equally suitable for value, growth, and momentum investors.
Outlook
Estimates have been trending upward for the stock and the magnitude of these revisions looks promising. Interestingly, MDLZ has a Zacks Rank #3 (Hold). We expect an in-line return from the stock in the next few months.
Shares of Caesars Entertainment (NASDAQ:CZR), a leading gambling stock, traded around 3% higher on Wednesday morning, though the stock was trading around 1.5% lower shortly before...
Amazon (NASDAQ:AMZN) is making a significant push into the future with a robust investment in robotics and artificial intelligence. The company has earmarked $35 billion for...
Home Depot’s (NYSE:HD) Q4 2024 report and guidance for 2025 have plenty to be unhappy about, but the simple truth is that this company turned a corner in 2024. It is on track for...
Are you sure you want to block %USER_NAME%?
By doing so, you and %USER_NAME% will not be able to see any of each other's Investing.com's posts.
%USER_NAME% was successfully added to your Block List
Since you’ve just unblocked this person, you must wait 48 hours before renewing the block.
I feel that this comment is:
Thank You!
Your report has been sent to our moderators for review
Add a Comment
We encourage you to use comments to engage with other users, share your perspective and ask questions of authors and each other. However, in order to maintain the high level of discourse we’ve all come to value and expect, please keep the following criteria in mind:
Enrich the conversation, don’t trash it.
Stay focused and on track. Only post material that’s relevant to the topic being discussed.
Be respectful. Even negative opinions can be framed positively and diplomatically. Avoid profanity, slander or personal attacks directed at an author or another user. Racism, sexism and other forms of discrimination will not be tolerated.
Perpetrators of spam or abuse will be deleted from the site and prohibited from future registration at Investing.com’s discretion.