


Sign up to create alerts for Instruments,
Economic Events and content by followed authors
Free Sign Up Already have an account? Sign In
Please try another search

Machinery behemoth The Middleby Corporation (NASDAQ:MIDD) reported moderate fourth-quarter 2017 results.
Earnings and Revenues
Quarterly adjusted earnings came in at $1.48 per share, in line with the Zacks Consensus Estimate. However, the bottom line came in higher than the year-ago tally of $1.44 per share.
Adjusted earnings for 2017 came in at $6.16 per share, outpacing the Zacks Consensus Estimate of $5.39. Also, the bottom line came in higher than the year-ago figure of $5.10 per share.
Net sales in the reported quarter came in at $632.9 million, up 6% year over year. However, the top line missed the Zacks Consensus Estimate of $647 million. The upswing was backed by favorable foreign currency-translation impact and acquisition benefits.
Net sales of Commercial Foodservice Equipment Group were up 13.7% year over year. However, revenues of the Food Processing Equipment and Residential Kitchen Equipment Groups slipped 1.8% and 5% respectively.
Net sales for full-year 2017 came in at $2,34 billion, up 3% year over year, missing the Zacks Consensus Estimate of $2.35 billion by a whisker.
The Middleby Corporation Price, Consensus and EPS Surprise
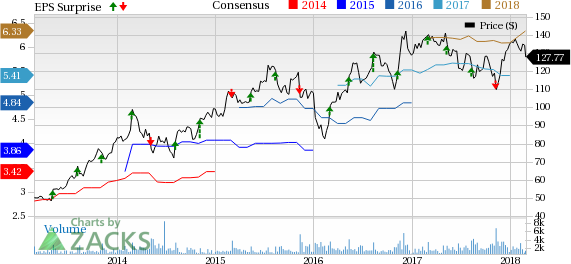
The Middleby Corporation Price, Consensus and EPS Surprise | The Middleby Corporation Quote
Costs and Margins
Cost of sales in the fourth quarter was $392.7 million compared to $357.6 million recorded in the year-ago quarter. Gross profit margin in the quarter came in at 37.9%, shrinking 220 basis points (bps) year over year. Gross margin dipped in the quarter due to reduced margins secured from acquired businesses.
Selling, general and administrative expenses totaled $110.8 million, as against $110.3 million incurred in the year-ago period. Operating margin came in at 10.9%, contracting 1030 basis points (bps) year over year.
Gross margin for the year was 39.1%, as against 39.7% recorded in the comparable period last year. Operating margin for 2017 came in at 17.6%, as against 19.7% recorded in the year-ago period.
Balance Sheet
Middleby exited the fourth quarter with cash and cash equivalents of $89.7 million, as against $68.5 million recorded at the end of 2016. Long-term debt was $1,023.7 million compared with $726.2 million recorded as of Dec 31, 2016.
Operating cash flow for 2017 was $304.5 million versus $294.1 million recorded in 2016.
During 2017, Middleby repurchased shares worth $239.8 million and deployed $300.2 million capital for acquisitions.
Outlook
This Zacks Rank #2 (Buy) company believes elevated demand for chain-restaurant customers will bolster revenues of its Commercial Foodservice Equipment Group. In addition, sturdy demand for the recently-launched products and solutions is anticipated to drive revenues of the Food Processing Equipment and Residential Kitchen Equipment Groups in the near term.
Other Stocks to Consider
Other top-ranked stocks within the same space are listed below:
Applied Industrial Technologies, Inc. (NYSE:AIT) sports a Zacks Rank of 1 (Strong Buy). The company’s earnings per share (EPS) are projected to be up 12% in the next three to five years. You can see the complete list of today’s Zacks #1 Rank stocks here.
Dover Corporation (NYSE:DOV) flaunts a Zacks Rank of 1. The company’s earnings per share (EPS) are estimated to be up 13% over the next three to five years.
RBC Bearings Incorporated (NASDAQ:ROLL) sports a Zacks Rank of 1. The company’s earnings per share (EPS) are projected to grow 5.87% during the same time frame.
Wall Street’s Next Amazon (NASDAQ:AMZN)
Zacks EVP Kevin Matras believes this familiar stock has only just begun its climb to become one of the greatest investments of all time. It’s a once-in-a-generation opportunity to invest in pure genius.
Click for details >>
The markets have been sluggish this week as investors hope for a jolt later in the week when AI juggernaut NVIDIA Corporation (NASDAQ:NVDA) reports fourth quarter and year-end...
On Friday, a wave of selling pressure swept across the US equity markets, leaving a trail of losses. The S&P 500 closed down 1.7%, the DOW slid 1.69%, and the NASDAQ tumbled a...
Palantir remains highly valued with a 460x P/E ratio and a 42.5x P/B ratio, far above its peers. The stock's beta of 2.81 signals high volatility, meaning sharp moves in both...
Are you sure you want to block %USER_NAME%?
By doing so, you and %USER_NAME% will not be able to see any of each other's Investing.com's posts.
%USER_NAME% was successfully added to your Block List
Since you’ve just unblocked this person, you must wait 48 hours before renewing the block.
I feel that this comment is:
Thank You!
Your report has been sent to our moderators for review
Add a Comment
We encourage you to use comments to engage with other users, share your perspective and ask questions of authors and each other. However, in order to maintain the high level of discourse we’ve all come to value and expect, please keep the following criteria in mind:
Enrich the conversation, don’t trash it.
Stay focused and on track. Only post material that’s relevant to the topic being discussed.
Be respectful. Even negative opinions can be framed positively and diplomatically. Avoid profanity, slander or personal attacks directed at an author or another user. Racism, sexism and other forms of discrimination will not be tolerated.
Perpetrators of spam or abuse will be deleted from the site and prohibited from future registration at Investing.com’s discretion.