- All Instrument Types
- Indices
- Equities
- ETFs
- Funds
- Commodities
- Currencies
- Crypto
- Bonds
- Certificates
Please try another search

Gold Catches A Trump Tailwind

It’s been a tough few days for USD bulls as the overriding theme of 2017, the trajectory of US interest rates has been subsumed in a constant stream of White House headlines. The overall effect has been to turn the market into a short-term headline driven beast. For all the noise the overall effect has been for the USD to weaken as the street gets nervous and talk of Trump Reflation and Federal Reserve rate hikes fades away. An excellent summary of last nights sound bites can be found here in my colleague Stephen Innes piece: Shock Rattle and Roll.
These last few days have seen safe-haven buying. Investors have flipped out of equities and into currencies such as yen and NZD. Gold has been the obvious beneficiary as well rallying some $30 an ounce from its lows last week. Gold has another $10 spurt yesterday touching 1215 before Asia has quietly unwound most of it to trade at 1208.50 as we move into the sessions close. This leaves the technical picture quite confused from my commentary last week, where the set-up was quite bearish on the daily charts.
To get a better picture, we need to look at both the hourly and daily charts today.
Gold Hourly
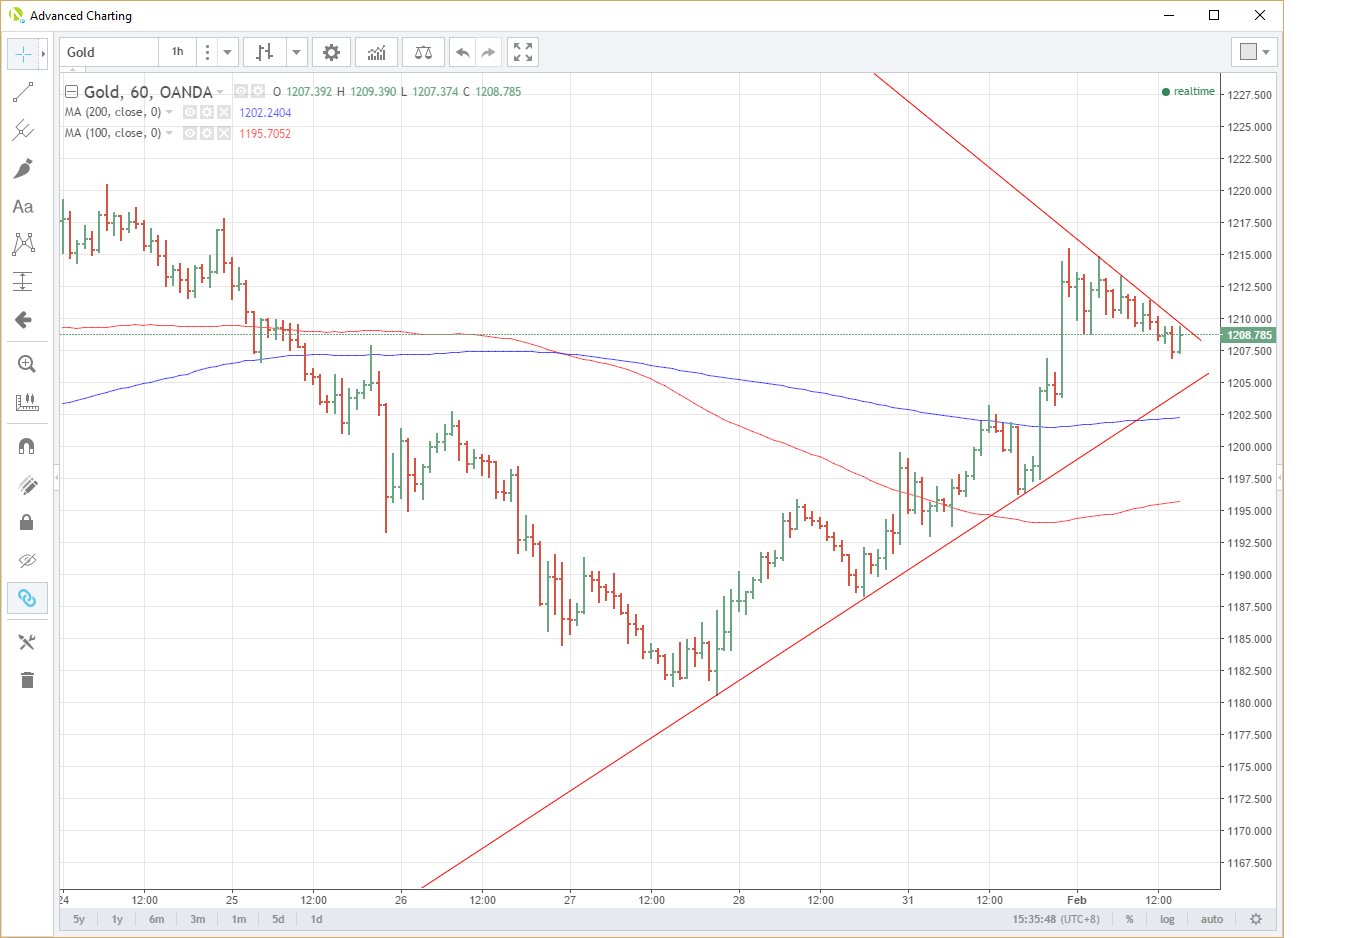
If we consider the hourly chart below, we see that gold has been in a very nice little uptrend since its lows of 1180.50. The bottom line of the triangle has held very nicely since January 28th, propelled by the White House-driven tailwind that started blowing over the weekend. Since late New York and into Asia the descending line of the triangle has formed a strong resistance.
How we interpret this can be two ways, firstly gold is making a topping formation, and a break of the support line at 1204 opens up a move all the way back to the 1183 area. Conversely, a break of the resistance line, currently at 1210, implies a technical move higher to 1231. (For clarity I have calculated the triangle’s vertical side as 1197 to 1218, $21).
However, the picture is not that simple as the daily chart is still telling a different story.
Gold Daily
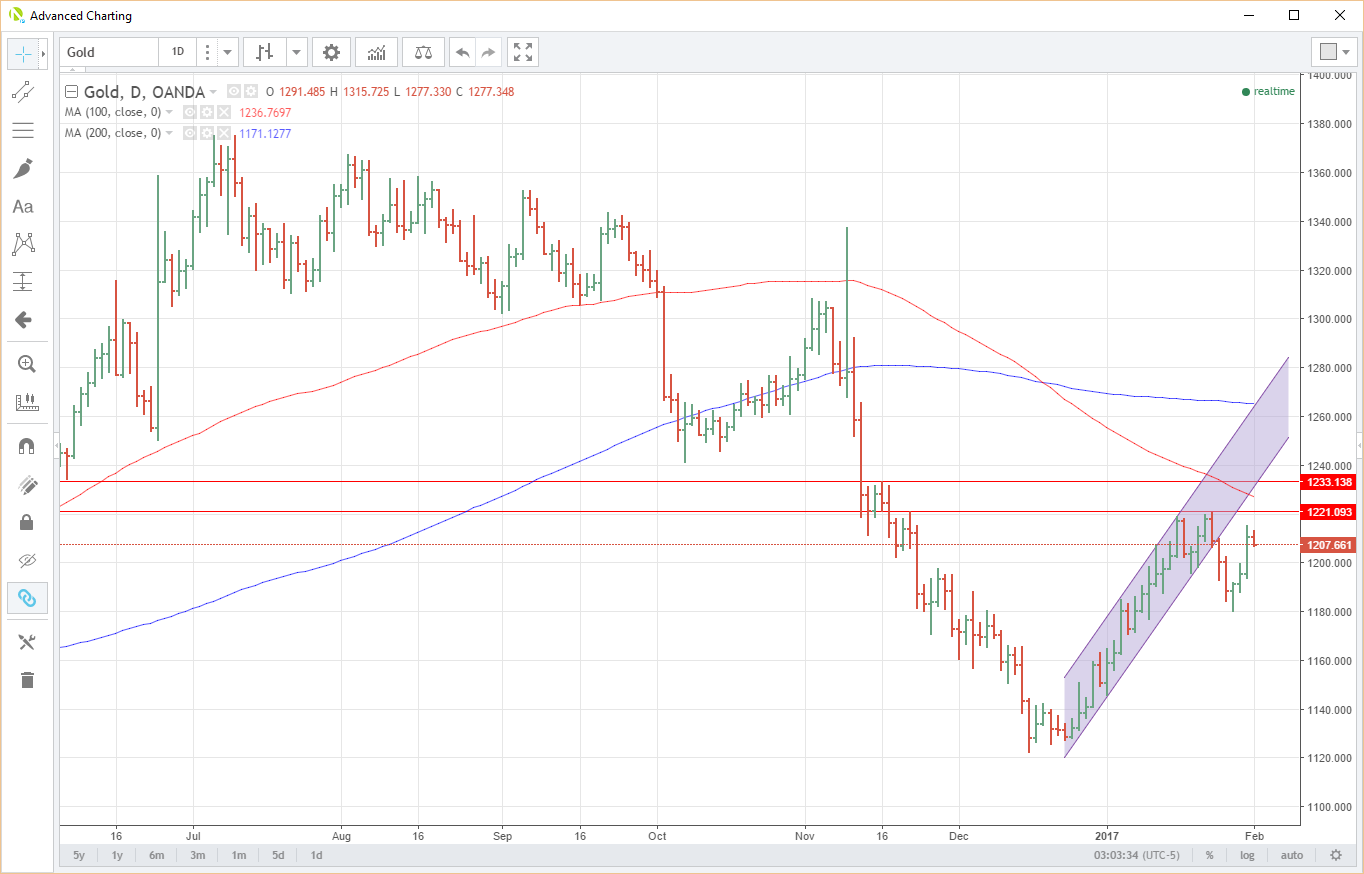
Despite the $30 rally in gold, the daily picture still has a bearish look to it. As per my commentary late last week, gold has well and truly broken its daily up channel which now becomes resistance. Despite the rally, it is nowhere near the extended base at 1233 today. Importantly, this is also a series of daily tops and a line of horizontal resistance as well.
Ahead of this, we have the 100-day moving average at 1227.25 and most importantly for more short-term traders, resistance at 1221.10. From a technical perspective, this first level at 1221.10 is the most important. Following from the hourly chart above, gold would walk into this level soon after a breakout of the hourly triangle. Gold has also failed in this general region numerous times since mid-November.
Support is not evident until the daily low of a few days ago around the 1180 area.
The Trumper-tantrums of the last five days has seen gold make a storming comeback as the USD weakens and investors seek safe havens. The short-term and longer-term charts post contrasting technical pictures. My best interpretation would be gold has the potential to break higher in the short-term but would almost immediately run into some serious longer term resistance. With the FOMC this evening and Non-Farm Payrolls (NFP) Friday, I certainly wouldn’t blame investors looking for a “haven” for now.
Should gold break lower on the short-term charts, this would reinforce the more bearish technical picture I have been describing longer-term. If we digress from technicals for a moment, a hawkish FOMC statement, a good NFP, clarity on the Trump reflation policies could all see USD strength return with a vengeance and rather quickly so. That said, it would be a brave man who bet against more White House headline bombs either!
Related Articles

President Trump has had success bringing down oil prices by sheer force of will and keeping traders off balance. Perhaps the biggest success has a lot to do with not only...

Will WTI crude oil hit 67.00 key level? MACD and stochastics indicate further losses WTI crude oil futures dived below the long-term descending trend line again, meeting the...

Oil prices are largely under pressure amid demand concerns, while the European gas market continues to sell off aggressively Energy – TTF Sell-Off Continues Oil prices continued...
Are you sure you want to block %USER_NAME%?
By doing so, you and %USER_NAME% will not be able to see any of each other's Investing.com's posts.
%USER_NAME% was successfully added to your Block List
Since you’ve just unblocked this person, you must wait 48 hours before renewing the block.
I feel that this comment is:
Thank You!
Your report has been sent to our moderators for review


Add a Comment
We encourage you to use comments to engage with other users, share your perspective and ask questions of authors and each other. However, in order to maintain the high level of discourse we’ve all come to value and expect, please keep the following criteria in mind:
Enrich the conversation, don’t trash it.
Stay focused and on track. Only post material that’s relevant to the topic being discussed.
Be respectful. Even negative opinions can be framed positively and diplomatically. Avoid profanity, slander or personal attacks directed at an author or another user. Racism, sexism and other forms of discrimination will not be tolerated.
Perpetrators of spam or abuse will be deleted from the site and prohibited from future registration at Investing.com’s discretion.