

Sign up to create alerts for Instruments,
Economic Events and content by followed authors
Free Sign Up Already have an account? Sign In
Please try another search

A month has gone by since the last earnings report for Maxim Integrated Products, Inc. (NASDAQ:MXIM) . Shares have added about 6.8% in that time frame, outperforming the market.
Will the recent positive trend continue leading up to the stock's next earnings release, or is it due for a pullback? Before we dive into how investors and analysts have reacted of late, let's take a quick look at its most recent earnings report in order to get a better handle on the important drivers.
Maxim Beats Q1 Earnings Estimates, Outlook Strong
Maxim reported first-quarter fiscal 2018 adjusted earnings of 60 cents per share, surpassing the Zacks Consensus Estimate by 5 cents. Also, earnings were up 25.0% from the year-ago quarter.
How Have Estimates Been Moving Since Then?
Analysts were quiet during the last month as none of them issued any earnings estimate revisions.
Maxim Integrated Products, Inc. Price and Consensus
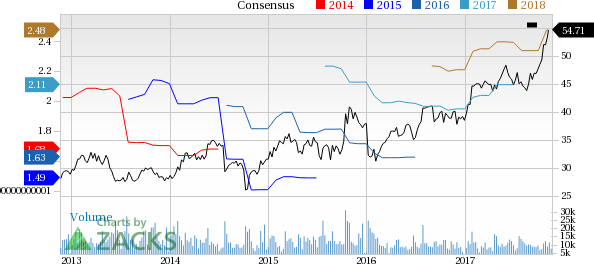
Maxim Integrated Products, Inc. Price and Consensus | Maxim Integrated Products, Inc. Quote
VGM Scores
Currently, Maxim's stock has a nice Growth Score of B, a grade with the same score on the momentum front. However, the stock was allocated a grade of D on the value side, putting it in the bottom 40% for this investment strategy.
Overall, the stock has an aggregate VGM Score of B. If you aren't focused on one strategy, this score is the one you should be interested in.
Our style scores indicate that the stock is equally suitable for growth and momentum investors.
Outlook
Notably, the stock has a Zacks Rank #3 (Hold). We expect in-line returns from the stock in the next few months.
These stocks provide a compelling case as safe-haven stocks in the face of an escalating trade war. Each company operates within sectors that are relatively resilient to economic...
When the market narrative becomes too widely accepted, excess seems to be created in some areas of the economy as businesses prepare for what’s coming their way. Today’s stock...
Markets are bouncing back as investors bet on technical support, tariff relief, and Germany’s stimulus plans. But with ISM and NFP data ahead, Fed rate cut bets could shift,...
Are you sure you want to block %USER_NAME%?
By doing so, you and %USER_NAME% will not be able to see any of each other's Investing.com's posts.
%USER_NAME% was successfully added to your Block List
Since you’ve just unblocked this person, you must wait 48 hours before renewing the block.
I feel that this comment is:
Thank You!
Your report has been sent to our moderators for review
Add a Comment
We encourage you to use comments to engage with other users, share your perspective and ask questions of authors and each other. However, in order to maintain the high level of discourse we’ve all come to value and expect, please keep the following criteria in mind:
Enrich the conversation, don’t trash it.
Stay focused and on track. Only post material that’s relevant to the topic being discussed.
Be respectful. Even negative opinions can be framed positively and diplomatically. Avoid profanity, slander or personal attacks directed at an author or another user. Racism, sexism and other forms of discrimination will not be tolerated.
Perpetrators of spam or abuse will be deleted from the site and prohibited from future registration at Investing.com’s discretion.