- All Instrument Types
- Indices
- Equities
- ETFs
- Funds
- Commodities
- Currencies
- Crypto
- Bonds
- Certificates
Please try another search

Energy And Materials Keep Underperforming S&P Sectors

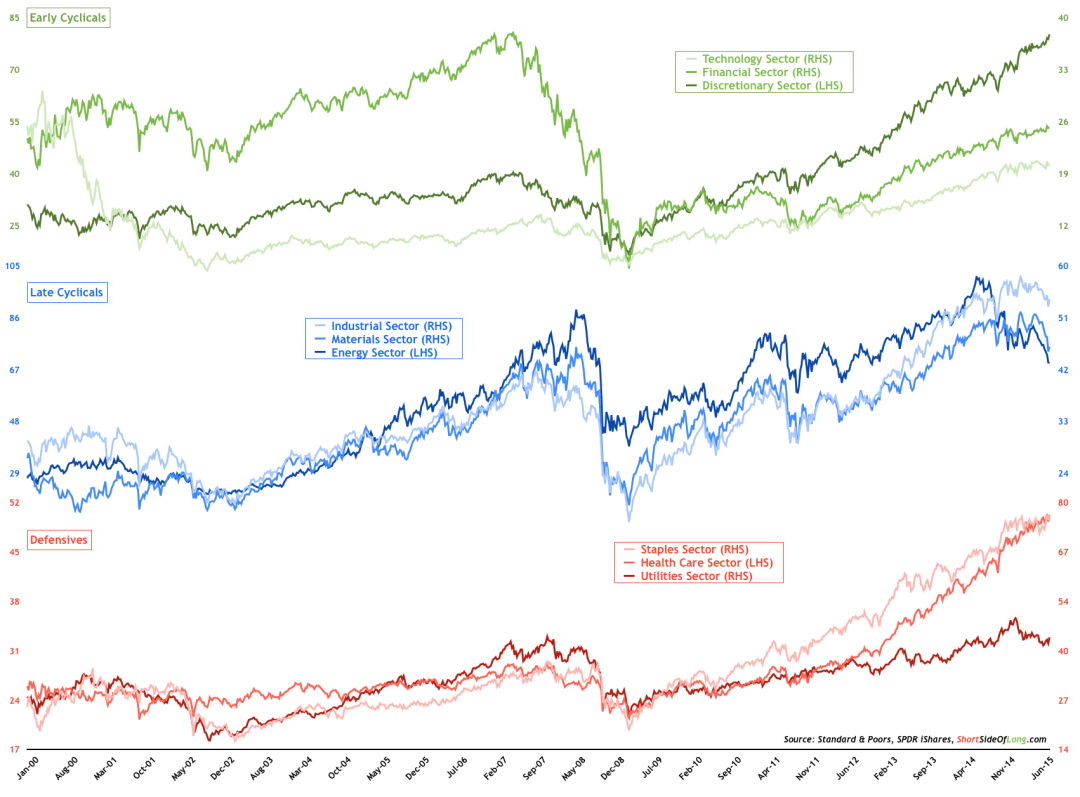
The majority of investors remember the great stock market peak in March 2000, however what investors fail to remember is that S&P 500 predominately fell due to the overvaluations in the technology sector (NYSE:XLK). Other sectors didn’t perform all that poorly, mainly trading sideways until the great bull market started in March 2003.
Moreover, during 2007, while whole stock market peaked out, the sell off was lead by the financial sector (ARCA:XLF). Later on in 2008, as commodities crashed, so too did energy (ARCA:XLE) and material sectors (ARCA:XLB).
Today, we have yet another fascinating situation with sector divergence. The energy sector continues to make 52-week new lows, and together with the materials sector, remains negative over the last 12-months (the only two sectors to do so). On the other hand, staples (ARCA:XLP), discretionary (ARCA:XLY), financials, healthcare (ARCA:XLV) and technology keep marching higher.
The energy sector now accounts for only 7% of S&P 500’s overall weighting; a far cry from its glory days in early 2008 at around 16%. Market participants should not forget that it was around this time that crude oil (NYSE:OIL) prices traded near $150 per barrel, while today, one barrel fetches $45. After all, industrial producers are closely linked to the raw material prices (NYSE:RJI) and the global supply / demand fundamentals.
Related Articles

Gold miners rallied Friday despite gold’s drop, hinting at a turnaround. This comes as gold struggles below key support, keeping downside risks in play. However, GDX’s bounce...

Gold bounces off $2,860 Remains below short-term ascending trend line RSI flattens, MACD eases Gold prices have recovered some of their losses from the previous days, touching...

Oil prices are weaker as OPEC+ confirms it will start reversing supply cuts, while tariff uncertainty is also hitting sentiment Energy- OPEC+ Set to Increase Supply Oil prices are...
Are you sure you want to block %USER_NAME%?
By doing so, you and %USER_NAME% will not be able to see any of each other's Investing.com's posts.
%USER_NAME% was successfully added to your Block List
Since you’ve just unblocked this person, you must wait 48 hours before renewing the block.
I feel that this comment is:
Thank You!
Your report has been sent to our moderators for review


Add a Comment
We encourage you to use comments to engage with other users, share your perspective and ask questions of authors and each other. However, in order to maintain the high level of discourse we’ve all come to value and expect, please keep the following criteria in mind:
Enrich the conversation, don’t trash it.
Stay focused and on track. Only post material that’s relevant to the topic being discussed.
Be respectful. Even negative opinions can be framed positively and diplomatically. Avoid profanity, slander or personal attacks directed at an author or another user. Racism, sexism and other forms of discrimination will not be tolerated.
Perpetrators of spam or abuse will be deleted from the site and prohibited from future registration at Investing.com’s discretion.