


Sign up to create alerts for Instruments,
Economic Events and content by followed authors
Free Sign Up Already have an account? Sign In
Please try another search

It has been about a month since the last earnings report for Lincoln National Corporation (NYSE:LNC) . Shares have lost about 14% in the past month, underperforming the market.
Will the recent negative trend continue leading up to its next earnings release, or is LNC due for a breakout? Before we dive into how investors and analysts have reacted as of late, let's take a quick look at its most recent earnings report in order to get a better handle on the important catalysts.
Lincoln National Beats on Q4 Earnings and Revenues
Lincoln National Corporation’s fourth-quarter 2017 earnings of $1.98 per share surpassed the Zacks Consensus Estimate by 2.06%. Also, bottom line increased about 12% year over year, led by higher premium and fees.
Operating revenues of $3.78 billion increased 7.3% year over year, surpassing the Zacks Consensus Estimate of $3.67 billion.
Insurance premium and fee income increased 18.8% and 9.4% from the prior-year quarter to $874 million and $1.47 billion, respectively.
Total expenses increased 32.7% to $4.06 billion year over year, mainly led by higher strategic digitization expense, partly offset by lower interest and debt expense.
Quarterly Segment Details
Operating income in each segment, except Life insurance, has been reportedly higher, compared to the prior-year quarter.
Annuities Remains Strong
Operating income increased 10% year over year to $265 million, due to higher fees income and average account values.
Total annuity deposits increased 54% from the year-ago quarter to $2.8 billion, driven by growth in all its major products.
Increased Contribution from Retirement Plan Services
Operating income increased 21% year over year to $41 million, driven by growth in fee income from higher average account values and expense ratio improvement.
Total deposits grew 1% from the prior-year quarter to $2.4 billion due to 29% increase in the first year, coupled with growth in recurring deposits.
Low Profitability in Life Insurance
Operating income declined 1.3% year over year to $152 million, due to higher variable investment income in the prior-year quarter.
Total Life insurance sales increased 5% from the prior-year quarter to $242 million, driven by growth in Executive Benefits, Term and VUL products.
High Profit in Group Protection
Operating income surged 25% from the year-ago quarter to $20 million. The upside was driven by an improvement in non-medical loss ratio. Sales in this segment remained unchanged year over year at $265 million, driven by growth across all product lines and in both employer and employee-paid sales.
Other Operations
The company incurred a loss of $38 million, almost equal to the loss of $37 million in the prior-year quarter.
Financial Update
As of Dec 31, 2017, Lincoln National’s book value per share, excluding accumulated other comprehensive income, climbed 13% year over year to $64.62 per share.
Operating return on equity (ROE), excluding accumulated other comprehensive income and goodwill, declined 70 bps from the year-ago quarter to 14.7%.
The company ended the quarter with long-term debt of $4.89 billion, down 10% year over year.
Share Buyback
During the quarter, the company repurchased 1.7 million shares of stock at a cost of $125 million.
How Have Estimates Been Moving Since Then?
In the past month, investors have witnessed a downward trend in fresh estimates. There has been one revision higher for the current quarter compared to two lower.
Lincoln National Corporation Price and Consensus
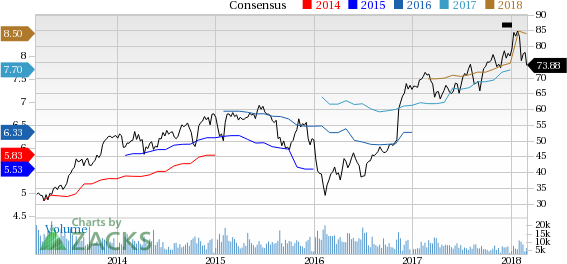
Lincoln National Corporation Price and Consensus | Lincoln National Corporation Quote
VGM Scores
At this time, LNC has a poor Growth Score of F, however its Momentum is doing a bit better with a D. However, the stock was allocated a grade of B on the value side, putting it in the top 40% for this investment strategy.
Overall,the stock has an aggregate VGM Score of D. If you aren't focused on one strategy, this score is the one you should be interested in.
The company's stock is suitable solely for value based on our styles scores.
Outlook
Estimates have been broadly trending downward for the stock and the magnitude of these revisions looks promising. Notably, LNC has a Zacks Rank #2 (Buy). We expect an above average return from the stock in the next few months.
Shares of Caesars Entertainment (NASDAQ:CZR), a leading gambling stock, traded around 3% higher on Wednesday morning, though the stock was trading around 1.5% lower shortly before...
Amazon (NASDAQ:AMZN) is making a significant push into the future with a robust investment in robotics and artificial intelligence. The company has earmarked $35 billion for...
Home Depot’s (NYSE:HD) Q4 2024 report and guidance for 2025 have plenty to be unhappy about, but the simple truth is that this company turned a corner in 2024. It is on track for...
Are you sure you want to block %USER_NAME%?
By doing so, you and %USER_NAME% will not be able to see any of each other's Investing.com's posts.
%USER_NAME% was successfully added to your Block List
Since you’ve just unblocked this person, you must wait 48 hours before renewing the block.
I feel that this comment is:
Thank You!
Your report has been sent to our moderators for review
Add a Comment
We encourage you to use comments to engage with other users, share your perspective and ask questions of authors and each other. However, in order to maintain the high level of discourse we’ve all come to value and expect, please keep the following criteria in mind:
Enrich the conversation, don’t trash it.
Stay focused and on track. Only post material that’s relevant to the topic being discussed.
Be respectful. Even negative opinions can be framed positively and diplomatically. Avoid profanity, slander or personal attacks directed at an author or another user. Racism, sexism and other forms of discrimination will not be tolerated.
Perpetrators of spam or abuse will be deleted from the site and prohibited from future registration at Investing.com’s discretion.