- All Instrument Types
- Indices
- Equities
- ETFs
- Funds
- Commodities
- Currencies
- Crypto
- Bonds
- Certificates
Please try another search

Leading Stocks Cooling Off, But Sector Rotation Keeping The Bears Away

We’ve begun seeing a bit of sector rotation lately, with leading stocks and sectors are cooling off, but formerly lagging industries seeing a bit of buying interest.
Institutional sector rotation is common in bull markets, and the rotation of funds from one industry to another enables broad market uptrends to remain intact, despite certain sectors being “overbought” (we hate that useless word).
The Technical Indicator That Never Lies
Volume is one of the most powerful technical indicators at our disposal because it tells us which side of the market banks, mutual funds, hedge funds, and other institutions are on.
Since institutional trading accounts for roughly 80% of the stock market’s average daily volume, the price action of stocks and ETFs is typically driven by the actions of the “smart money.”
For this reason, volume is considered a leading indicator, rather than a lagging one.
If, for example, an equity is under distribution, it will eventually drop.
Conversely, an equity will eventually rise if under accumulation.
This is why our trading system is based on always following the dominant stock market trend (riding on the coat tails of institutions).
Where’s The Money Flowing?
Solar energy, one of the leading sectors of the last wave up in the market, is one example of an industry that has come under short-term distribution.
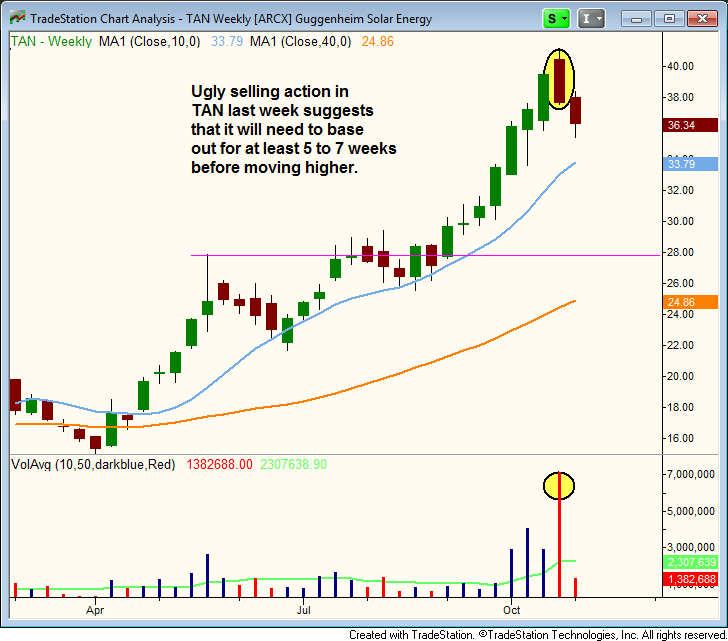
This can be seen on the weekly chart of Guggenheim Solar ETF (TAN), an ETF we recently sold for a 44% gain in The Wagner Daily newsletter:
Notice the massive volume spike that accompanied last week’s 4.6% sell-off at the highs, which has so far led to further selling this week.
That high volume decline is the biggest clue that this ETF is now in correction mode, and may now need to form a base of consolidation for the next several weeks.
Specifically, we expect TAN to come into support of its 10-week moving average (teal line) before it is considered a low-risk re-entry on the buy side again.
As for sectors seeing positive inflow of institutional funds, we are noticing improving price action in Financials.
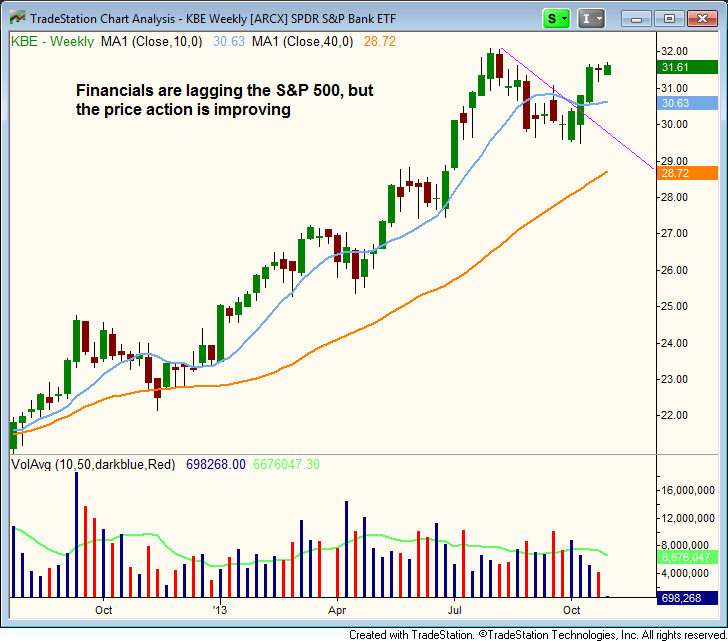
On the weekly chart below, notice that S&P SPDR Bank ETF (KBE) is now trading at its highest level of the past several weeks:
Although the banking sector has overall lacked relative strength to the S&P 500, KBE is staging a bit of a comeback after living below its 10-week MA from late August to early October.
KBE is back above its 10-week moving average, and the price action moving in a tight, sideways range above the rising 20-day exponential moving average on the daily chart (not shown).
Watch KBE and financial stocks for continued signs of bullish sector rotation, which may make it possible to buy a breakout in this sector.
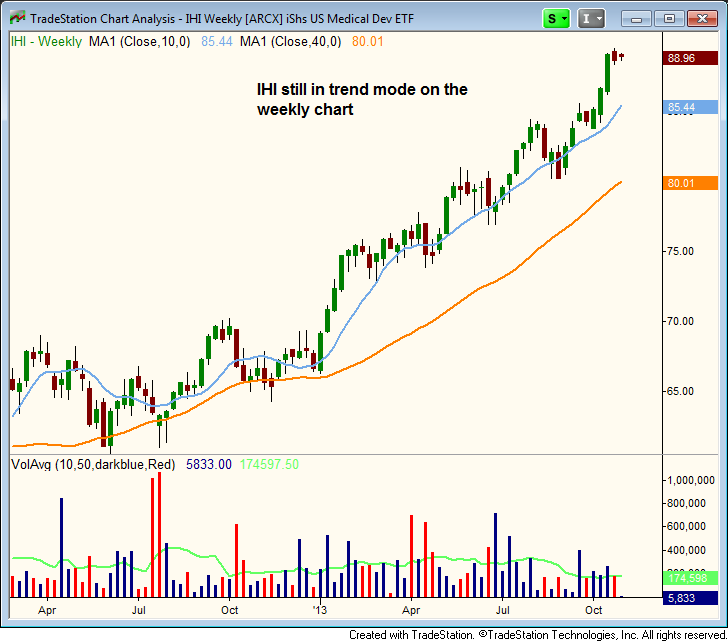
The iShares US Medical Devices ETF (IHI) is an ETF that has not only been a market leader for many months, but continues to hold near its highs without signs of distribution.
IHI broke out from its last base three weeks ago, and the price is still trading near its highs (above the 10-day moving average on the daily chart). The weekly chart below shows the strong uptrend:
Another sector we have our eye on is precious metals (gold and silver ETFs such as GLD and SLV).
Although precious metals have been weak, the weekly charts are now showing the formation of higher lows and a significant bullish trend reversal may be shaping up in the near-term.
We’ll keep you updated here on our blog if we decide to take action.
Overall Stock Market Pulse?
As for the general health of the broad market, individual leadership stocks have begun showing a bit of relative weakness to the broad market averages lately, but mostly remain in good shape.
Since the performance of individual leading growth stocks is one of the most important factors in our market timing system, we are on alert for any red flags that could be an early warning that a significant market correction is coming.
However, unless leading stocks begin breaking down below their 50-day moving averages en masse, we are not concerned about a healthy pullback and accompanying sector rotation in the market.
It’s important to note that several leading stocks are scheduled to report quarterly earnings within the next few weeks. For example, both LNKD and YELP report after today’s (October 29) close.
The reaction to these earning reports (NOT the numbers themselves) will tell us a lot about the health of the market.
By the first or second week of November, we should have a pretty good idea whether or not recent market momentum will at least carry itself through the end of the year.
Original post
Related Articles

• Trump’s trade war, inflation data, and last batch of earnings will be in focus this week. • DoorDash’s imminent inclusion in the S&P 500 is likely to trigger a wave of...

The big US stocks dominating markets and investors’ portfolios just finished another earnings season. They reported spectacular collective results including record sales, profits,...

“Quality” stocks with strong fundamentals tend to be rewarding places to stash hard-earned money. Since 2009, investing in a basket of quality stocks over a standard index has...
Are you sure you want to block %USER_NAME%?
By doing so, you and %USER_NAME% will not be able to see any of each other's Investing.com's posts.
%USER_NAME% was successfully added to your Block List
Since you’ve just unblocked this person, you must wait 48 hours before renewing the block.
I feel that this comment is:
Thank You!
Your report has been sent to our moderators for review


Add a Comment
We encourage you to use comments to engage with other users, share your perspective and ask questions of authors and each other. However, in order to maintain the high level of discourse we’ve all come to value and expect, please keep the following criteria in mind:
Enrich the conversation, don’t trash it.
Stay focused and on track. Only post material that’s relevant to the topic being discussed.
Be respectful. Even negative opinions can be framed positively and diplomatically. Avoid profanity, slander or personal attacks directed at an author or another user. Racism, sexism and other forms of discrimination will not be tolerated.
Perpetrators of spam or abuse will be deleted from the site and prohibited from future registration at Investing.com’s discretion.