


Sign up to create alerts for Instruments,
Economic Events and content by followed authors
Free Sign Up Already have an account? Sign In
Please try another search

Driven by surge in trading revenues, The Goldman Sachs Group, Inc.’s (NYSE:GS) third-quarter 2016 results recorded a positive earnings surprise of 26%. The company reported earnings per share of $4.88, outpacing the Zacks Consensus Estimate of $3.86. Moreover, the bottom line witnessed significant improvement of 68% year over year.
Shares were in the green in opening trade, displaying encouragement among investors following the release. The price reaction during the later part of the trading session will give a fair idea about whether Goldman was able to meet expectations.
Results were primarily aided by fixed income revenues, partially offset by higher expenses. Management stated that though market-making conditions improved in the reported quarter from the prior-year quarter, the Fixed Income, Currency and Commodities Client Execution unit continued to face a challenging environment with low interest rates and sluggish global economic growth.
Net earnings of $2.1 billion reflected a whopping 47% rise from prior-year quarter.
Strong Trading Drives Revenues, Costs Up
Goldman’s net revenue soared 19% year over year to $8.2 billion in the quarter under review. Also, revenues exceeded the Zacks Consensus Estimate of $7.6 billion.
Quarterly revenues, as per business segments, are as follows:
The Institutional Client Services division recorded revenues of $3.7 billion, up 17% year over year. The rise reflected strong growth in Fixed Income, Currency and Commodities Client Execution revenues (up 34% year over year), driven by revenues from interest rate and products and credit products, along with higher revenues in mortgages. However, these increases were partially offset by reduced revenues in currencies and commodities.
Supported by higher net revenues in equities client execution, the company recorded growth in Equities revenues (up 2%). However, lower volumes resulted in reduced commissions and fees.
The Investment Banking division generated revenues of $1.5 billion, down 1% year over year. Results reflected lower financial advisory revenues (down 19%), impacted by the decreased number of completed mergers and acquisitions during the quarter. However, the quarter witnessed higher debt underwriting as well as equity underwriting fees.
The Investment Management division recorded revenues of $1.5 billion, up 4% year over year. The growth was mainly driven by higher incentive fees while management and other fees remained relatively unchanged.
The Investing and Lending division’s revenues of $1.4 billion in the quarter increased significantly year over year. The rise was aided by surge in revenues from investments in equities as well as higher revenues in debt securities and loans.
Total operating expenses increased 10% year over year to $5.3 billion. Expenses grew largely due to higher compensation and employee benefits expenses (up 36%). The rise was partially offset by lower non-compensation expenses (down 15%) due to decreased provisions for litigation and regulatory proceedings, reduced brokerage, clearing, exchange and distribution fees, market development and other expenses.
Strong Capital Position
Goldman exhibited a robust capital position in the reported quarter. As of Sep 30, 2016, the company’s Common Equity Tier 1 ratio was 12.4% under the Basel III Advanced Approach, reflecting the valid transitional provisions. The figure was up from 12.2% in the prior quarter. The company’s supplementary leverage ratio on a fully phased-in basis was 6.3% at the end of the third quarter, up from 6.1% in the prior quarter.
Adjusted return on average common shareholders’ equity, on an annualized basis, was 11.2% in the reported quarter.
Capital Deployment Update
During third-quarter 2016, the company repurchased 7.8 million shares of its common stock at an average price per share of $162.83 and at a total cost of $1.27 billion.
Conclusion
Results of Goldman reflect a sturdy quarter. The company’s well-diversified business, apart from its solid investment banking operations, continues to ensure earnings stability. Its focus to capitalize on new growth opportunities through several strategic investments, including its digital consumer lending platform should bolster overall business growth. However, costs stemming from unresolved litigations and stringent financial reforms remain near-to medium-term headwinds.
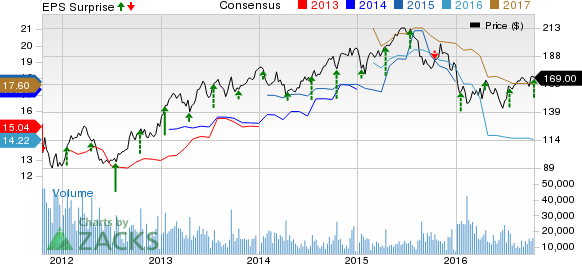
GOLDMAN SACHS Price, Consensus and EPS Surprise
Goldman carries a Zacks Rank #3 (Hold). You can see the complete list of today’s Zacks #1 (Strong Buy) Rank stocks here.
Performance of Other Major Banks
Among major banks, JPMorgan Chase & Co.’s (NYSE:JPM) third-quarter 2016 earnings of $1.58 per share handily surpassed the Zacks Consensus Estimate of $1.40. However, the figure reflects a 6% decline from the year-ago period. Notably, the results included a legal benefit of $71 million.
Driven by a strong top-line growth, Wells Fargo & Company’s (NYSE:WFC) third-quarter 2016 earnings recorded a positive surprise of about 1%. Earnings of $1.03 per share beat the Zacks Consensus Estimate by a penny. However, it compared unfavorably with the prior-year quarter’s earnings of $1.05 per share.
Driven by decline in operating expenses, Citigroup Inc. (NYSE:C) delivered a positive earnings surprise of nearly 8% in third-quarter 2016. The company’s earnings from continuing operations per share of $1.25 for the quarter outpaced the Zacks Consensus Estimate of $1.16. However, earnings compared unfavorably with the year-ago figure of $1.36 per share.
Confidential from Zacks
Beyond this Analyst Blog, would you like to see Zacks' best recommendations that are not available to the public? Our Executive VP, Steve Reitmeister, knows when key trades are about to be triggered and which of our experts has the hottest hand. Click to see them now>>
Home Depot’s (NYSE:HD) Q4 2024 report and guidance for 2025 have plenty to be unhappy about, but the simple truth is that this company turned a corner in 2024. It is on track for...
Nvidia is scheduled to release its Q4 earnings report at 4:20PM ET on Wednesday. A call with CEO Jensen Huang is set for 5:00PM ET. The chipmaker’s results will serve as a...
Warren Buffett has always critiqued airline stocks for being overly capital-intensive, exhibiting low growth, and relying heavily on cyclical consumer travel patterns—further...
Are you sure you want to block %USER_NAME%?
By doing so, you and %USER_NAME% will not be able to see any of each other's Investing.com's posts.
%USER_NAME% was successfully added to your Block List
Since you’ve just unblocked this person, you must wait 48 hours before renewing the block.
I feel that this comment is:
Thank You!
Your report has been sent to our moderators for review
Add a Comment
We encourage you to use comments to engage with other users, share your perspective and ask questions of authors and each other. However, in order to maintain the high level of discourse we’ve all come to value and expect, please keep the following criteria in mind:
Enrich the conversation, don’t trash it.
Stay focused and on track. Only post material that’s relevant to the topic being discussed.
Be respectful. Even negative opinions can be framed positively and diplomatically. Avoid profanity, slander or personal attacks directed at an author or another user. Racism, sexism and other forms of discrimination will not be tolerated.
Perpetrators of spam or abuse will be deleted from the site and prohibited from future registration at Investing.com’s discretion.