


Sign up to create alerts for Instruments,
Economic Events and content by followed authors
Free Sign Up Already have an account? Sign In
Please try another search

Kronos Worldwide, Inc. (NYSE:KRO) logged a profit of $9.4 million or 8 cents per share in fourth-quarter 2019, down from $24 million or 21 cents in the year-ago quarter. Earnings missed the Zacks Consensus Estimate of 10 cents.
Results in the reported quarter were impacted by lower average selling prices and increased raw materials as well as other production costs, which were partly offset by higher sales volumes.
Net sales rose 6.7% year over year to $372.7 million on the back of higher sales volumes and reduced average titanium dioxide (TiO2) selling prices. However, the figure trailed the Zacks Consensus Estimate of $378 million.
2019 Highlights
In 2019, the company reported profit of $87.1 million or 75 cents per share, down from $205 million or $1.77 per share recorded in 2018.
Net sales in the year rose 4.2% year over year to $1,731.1 million.
Kronos Worldwide Inc Price, Consensus and EPS Surprise
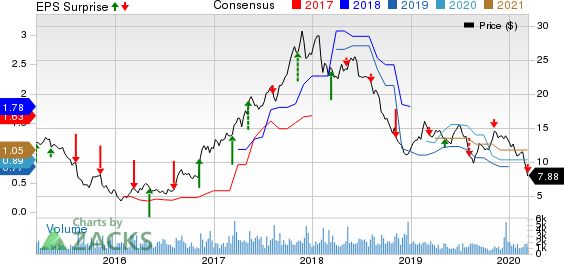
Kronos Worldwide Inc price-consensus-eps-surprise-chart | Kronos Worldwide Inc Quote
Volumes and Pricing
Average TiO2 selling prices fell 3% year over year in the reported quarter.
The company’s TiO2 sales volume increased 14% year over year owing to increased sales in the European and export markets, which were partly offset by lower sales in the Latin American and North American markets. TiO2 production volumes rose 4% year over year in the fourth quarter.
Profit in the TiO2 segment plunged 56.3% year over year to $21.1 million in the fourth quarter.
Balance Sheet
Kronos Worldwide ended 2019 with cash and cash equivalents of $390.8 million, up 4.7% year over year. Long-term debt was $444 million, down 2.4% year over year.
Cash flows from operating activities were $160.3 million for 2019, down 15% year over year.
Outlook
For 2020, Kronos Worldwide expects production volumes to be modestly higher on a year-over-year basis. However, the company anticipates slightly lower sales volumes compared with 2019 based on expected production levels and assuming global economic conditions to remain stable (including the limited impact of coronavirus). The company stated that it will continue to examine current and expected customer demand levels in the near term as well as align its inventories and production accordingly.
Overall, the company expects sales to be slightly lower year over year in 2020, mainly resulting from lower expected sales volumes. Additionally, the company expects lower income from operations this year due to higher raw material costs (mainly feedstock) and lower expected sales volumes.
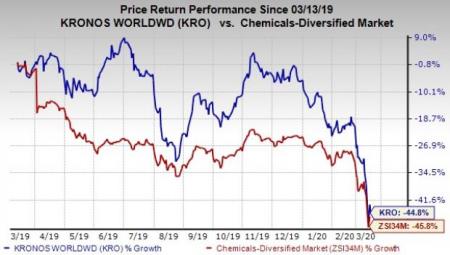
Price Performance
Shares of Kronos Worldwide have lost 44.8% in the past year compared with 45.8% decline of the industry.
New tariffs stoke inflation fears and rattle markets. With recession risks rising, defensive stocks look more appealing. InvestingPro spots three undervalued picks with...
The market for 3M (NYSE:MMM) stock is on fire, with shares rising by 7% in the final week of February and 65% in the preceding 12 months, and there is more upside ahead. The...
There are times when markets are driven by fear, keeping most investors away from what could be a life-changing trade or investment only because the rest of the media and...
Are you sure you want to block %USER_NAME%?
By doing so, you and %USER_NAME% will not be able to see any of each other's Investing.com's posts.
%USER_NAME% was successfully added to your Block List
Since you’ve just unblocked this person, you must wait 48 hours before renewing the block.
I feel that this comment is:
Thank You!
Your report has been sent to our moderators for review
Add a Comment
We encourage you to use comments to engage with other users, share your perspective and ask questions of authors and each other. However, in order to maintain the high level of discourse we’ve all come to value and expect, please keep the following criteria in mind:
Enrich the conversation, don’t trash it.
Stay focused and on track. Only post material that’s relevant to the topic being discussed.
Be respectful. Even negative opinions can be framed positively and diplomatically. Avoid profanity, slander or personal attacks directed at an author or another user. Racism, sexism and other forms of discrimination will not be tolerated.
Perpetrators of spam or abuse will be deleted from the site and prohibited from future registration at Investing.com’s discretion.