


Sign up to create alerts for Instruments,
Economic Events and content by followed authors
Free Sign Up Already have an account? Sign In
Please try another search

The stock market runs on sentiment and any unforeseen event in a particular sector has a ripple effect on others with a clear reflection on major indices that bear the brunt. The case is more or less the same for specific sectors that often observe good or bad performance by one player influencing the performance of others.
While major indices — Dow Jones Industrial Average, Nasdaq and S&P 500 ended the Friday’s trading session on a positive note, the SPDR S&P Retail ETF (MX:XRT) fell 1.5%. We believe J. C. Penney Company, Inc. (NYSE:JCP) disappointing forecast may have been one of the reasons behind the SPDR S&P Retail ETF’s decline.
Dismal Forecast
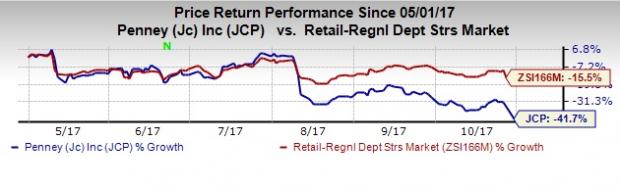
Shares of J. C. Penney tanked 14.8% on Oct 27 after the company trimmed full-year guidance. In fact, this Zacks Rank #4 (Sell) stock has tumbled 41.7% in the past six months, wider than the industry’s decline of 15.5%. The company stated that in an effort to clear “slow-moving” goods mostly in women’s apparel department it increased markdowns in September and October.
Chairman and chief executive officer of the company, Marvin R. Ellison said, “With a sharper and more disciplined focus on inventory management, we are taking a comprehensive approach to assessing the effectiveness of our inventory positions to make swift, informed decisions that promote faster inventory turn and higher productivity levels.”
Management also stated that following the liquidation of slow moving inventory, the company’s fund has increased. This will help to invest in fresh as well as trending merchandise categories.
For third-quarter fiscal 2017, the company expects comparable sales to grow between 0.6% and 0.8 %. However, cost of goods (excluding depreciation and amortization) to rise 300-320 basis points (bps) year over year.
In the third quarter, the company expects adjusted loss to be in the range of 45-40 cents per share. In third-quarter fiscal 2016, the company has reported loss per share of 21 cents.
For fiscal 2017, the comps is projected to be in the range of down 1% to flat, compared with the earlier estimate of down 1% to up 1%. Cost of goods sold is now forecasted to increase by 100-120 bps year over year, while free cash flow is anticipated to be in the range of $200-$300 million. The company now expects adjusted earnings per share to be in the range of 2- 8 cents, sharply below the earlier estimate of 40-65 cents.
Following the news, investors pressed the panic button that took a toll on other retail stocks.
Kohl's Corporation (NYSE:KSS) stock declined 4.6% following the news. The company has reported positive earnings surprise in the trailing four quarters, with an average beat of 18%. For the third quarter, the Zacks Consensus Estimate is pegged at 71 cents, down nearly 11% year over year. Kohl's currently carries a Zacks Rank #2 (Buy). You can see the complete list of today’s Zacks #1 Rank (Strong Buy) stocks here.
Shares of Dillard's, Inc. (NYSE:DDS) , which operates as fashion apparel, cosmetics, and home furnishing retailer, declined 3.4%. This Zacks Rank #4 (Sell) company’s consensus estimate for third-quarter fiscal 2017 is pegged at 23 cents per share, down nearly 66% year over year. Further, the company’s long-term earnings growth rate is pegged at 2.6%, well below the industry’s growth rate of 5.6%.
Shares of Macy's, Inc. (NYSE:M) decreased 7.7%. After witnessing negative earnings surprise in first-quarter fiscal 2017, the company posted earnings beat of 6.7% in the second quarter. For the third quarter, the consensus estimate currently stands at 19 cents, up nearly 13% year over year. Macy’s currently carries a Zacks Rank #3 (Hold).
Zacks’ Best Private Investment Ideas
While we are happy to share many articles like this on the website, our best recommendations and most in-depth research are not available to the public.
Starting today, for the next month, you can follow all Zacks' private buys and sells in real time. Our experts cover all kinds of trades… from value to momentum . . . from stocks under $10 to ETF and option moves . . . from stocks that corporate insiders are buying up to companies that are about to report positive earnings surprises. You can even look inside exclusive portfolios that are normally closed to new investors.
Click here for Zacks' private trades >>
Home Depot’s (NYSE:HD) Q4 2024 report and guidance for 2025 have plenty to be unhappy about, but the simple truth is that this company turned a corner in 2024. It is on track for...
Nvidia is scheduled to release its Q4 earnings report at 4:20PM ET on Wednesday. A call with CEO Jensen Huang is set for 5:00PM ET. The chipmaker’s results will serve as a...
Warren Buffett has always critiqued airline stocks for being overly capital-intensive, exhibiting low growth, and relying heavily on cyclical consumer travel patterns—further...
Are you sure you want to block %USER_NAME%?
By doing so, you and %USER_NAME% will not be able to see any of each other's Investing.com's posts.
%USER_NAME% was successfully added to your Block List
Since you’ve just unblocked this person, you must wait 48 hours before renewing the block.
I feel that this comment is:
Thank You!
Your report has been sent to our moderators for review
Add a Comment
We encourage you to use comments to engage with other users, share your perspective and ask questions of authors and each other. However, in order to maintain the high level of discourse we’ve all come to value and expect, please keep the following criteria in mind:
Enrich the conversation, don’t trash it.
Stay focused and on track. Only post material that’s relevant to the topic being discussed.
Be respectful. Even negative opinions can be framed positively and diplomatically. Avoid profanity, slander or personal attacks directed at an author or another user. Racism, sexism and other forms of discrimination will not be tolerated.
Perpetrators of spam or abuse will be deleted from the site and prohibited from future registration at Investing.com’s discretion.