


Sign up to create alerts for Instruments,
Economic Events and content by followed authors
Free Sign Up Already have an account? Sign In
Please try another search

GBP/JPY fell sharply on Thursday, after the BoE kept its policy unchanged, with only one member voting in favor of QE tapering. That member was Chief Economist Andy Haldane, for whom this was the last meeting.
The Bank repeated that the surge in inflation is expected to be transitory, and added that they do not want to undermine the recovery by premature tightening, disappointing those expecting signals that something like that could be announced at the next gathering.
From a technical standpoint, GBP/JPY was trading in a consolidative manner near the downside line drawn from the high of May 27 ahead of the decision, but fell below 154.55, an intraday swing low formed yesterday, immediately thereafter. In our view, this is an early signal that the latest recovery of the pair may be over and that the bears are willing to push the action lower.
We believe that the first support to consider on the bears’ way south may be Monday’s inside swing high, at 153.75, the break of which could allow a test near the 153.10 barrier, marked by Tuesday’s low. If that hurdle is broken as well, then we could see the fall extending towards the 152.42 area, or Monday’s low, at around 151.33.
Taking a look at our short-term oscillators, we see that the RSI has turned down after hitting resistance slightly below 70. Now it is fractionally above 50, but continues to point south and appears ready to fall below that equilibrium line.
The MACD, although above both its zero and trigger lines, has turned down as well. Both indicators suggest that GBP/JPY has run out of upside momentum, enhancing the case that the latest recovery may already be over.
Now, in order to start examining whether the bulls are back into the action and have taken full control, we would like to see a decisive break above 155.50, a resistance defined by the high of June 15.
The rate would already be above the downside line taken from the high of May 27, and thus, the bulls may feel confident to push the action towards that high, at around 156.05. If they are strong enough to overcome that obstacle as well, then we may see them aiming for the high of Feb. 2, 2018, at around 156.60.
In order to identify the next potential resistance zone, we need to go back to 2016 and the day after the Brexit referendum. We will consider as the next resistance the high of that day, which is at around 157.95.
As investors attempt to keep up with the daily shift in President Trump’s tariff policies, the February CPI report out of the United States on Wednesday will likely come as a...
Japanese yen extends rally for a third consecutive day BoJ’s Uchida says rate hikes still on the table despite tariff concerns US nonfarm payrolls expected to edge slightly The...
EUR/USD is trading near 1.0806 on Friday, maintaining its position despite failing to extend its gains further. Investors’ focus is on February’s upcoming US employment data,...
Are you sure you want to block %USER_NAME%?
By doing so, you and %USER_NAME% will not be able to see any of each other's Investing.com's posts.
%USER_NAME% was successfully added to your Block List
Since you’ve just unblocked this person, you must wait 48 hours before renewing the block.
I feel that this comment is:
Thank You!
Your report has been sent to our moderators for review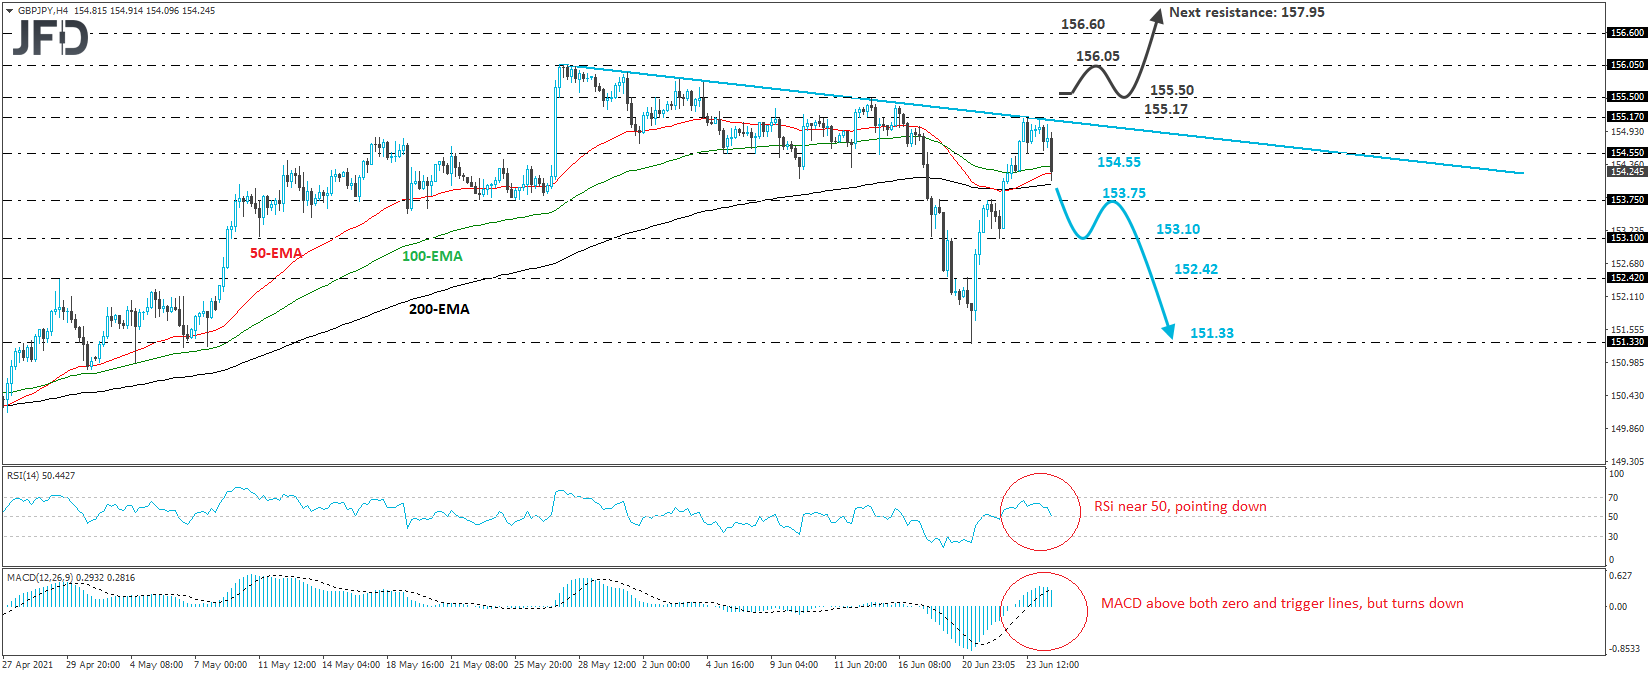

Add a Comment
We encourage you to use comments to engage with other users, share your perspective and ask questions of authors and each other. However, in order to maintain the high level of discourse we’ve all come to value and expect, please keep the following criteria in mind:
Enrich the conversation, don’t trash it.
Stay focused and on track. Only post material that’s relevant to the topic being discussed.
Be respectful. Even negative opinions can be framed positively and diplomatically. Avoid profanity, slander or personal attacks directed at an author or another user. Racism, sexism and other forms of discrimination will not be tolerated.
Perpetrators of spam or abuse will be deleted from the site and prohibited from future registration at Investing.com’s discretion.