- All Instrument Types
- Indices
- Equities
- ETFs
- Funds
- Commodities
- Currencies
- Crypto
- Bonds
- Certificates
Please try another search

Is The Dow Jones Industrial Average About To Pullback?

From Corey Rosenbloom: With the Dow Jones Index surging seven days in a row straight up, we’d be totally crazy to plan for a pullback instead of buying, buying, buying a rally that’s never going to end. Right?
Right?
Let’s at least PLAN for the potential (likely/inevitable?) pullback yet to come in the Dow and it could start today.
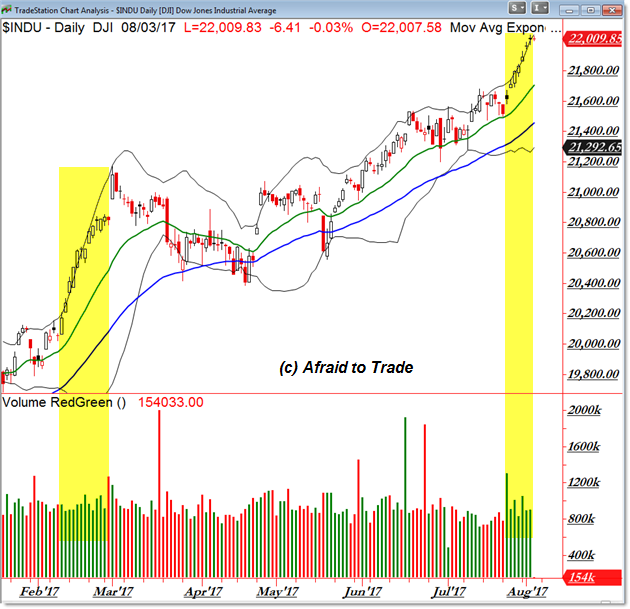
Here’s the Dow Jones Daily Chart breaking above 22,000 for the first time ever:

We have a “Perfect Pullback” in a rising market to the 20-day EMA (green) in late July.
From there, buyers surged the market higher day after day all the way to the current high.
Tuesday and Wednesday’s sessions gave us doji reversal candles ABOVE the upper Bollinger Band® which – in normal times – is a sign of caution.
Before we step inside the current price action, let’s take a look at February 2017.
We saw a similar pullback to the rising 20-day EMA ignite a bullish fire that sent the Dow surging toward – then above – 21,000 in a roughly 14 day straight-up rally (we’re only at seven now).
When all looked bleak with similar reversal candles into 21,000, we saw a HUGE bullish gap-up into 21,200 before price spent the next two full months pulling back in a retracement phase.
Draw comparisons from this period to what we’re seeing now.
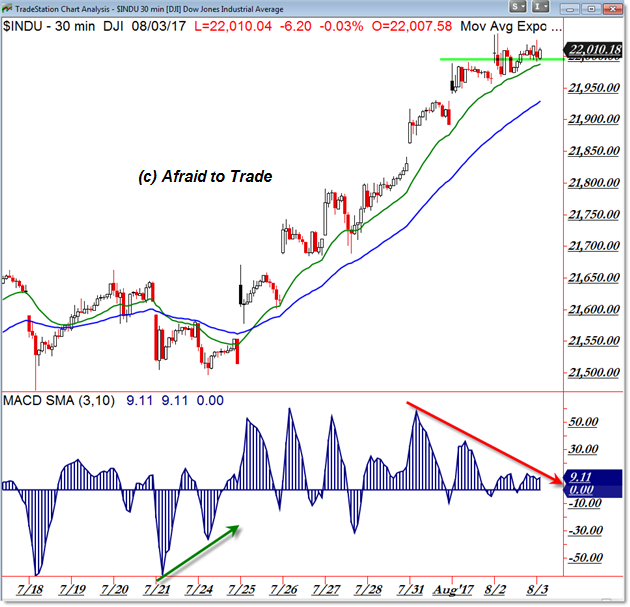
Let’s step INSIDE the price action to the 30-min intraday chart:

We see the end-of-July non-stop bullishly gapping, stable rally from 21,500 to 22,000.
Momentum (and volume) were strong in the beginning of the rally which confirmed the bullish price action, suggesting even higher prices likely yet to come (and they did).
As those new price highs toward 22,000 developed, momentum began declining (diverging) on both Tuesday and Wednesday.
We’re seeing low/flat momentum readings right now into the critical 22,000 pivot.
Simply stated, you should at least PLAN for a Pullback/Retracement and be ready to take profits or (aggressively) short-sell it to trade a departure from 22,000.
If February is our guide, then we could be in store for one more bullish burst ABOVE 22,000 before the proper pullback occurs.
Either way, get ready to adjust your positions and plan your next move away from 22,000.
The SPDR Dow Jones Industrial Average ETF (NYSE:DIA) was trading at $219.98 per share on Thursday morning, up $0.09 (+0.04%). Year-to-date, DIA has gained 12.65%, versus a 11.54% rise in the benchmark S&P 500 index during the same period.
DIA currently has an ETF Daily News SMART Grade of A (Strong Buy), and is ranked #5 of 76 ETFs in the Large Cap Value ETFs category.
Related Articles

The oldest ETF, the SPDR S&P 500 Trust, had the most inflows in February. The $14.6 billion in inflows allowed it to surpass the Vanguard S&P 500 ETF. Which ETFs saw the...

If the Vanguard S&P 500 Index ETF (VFV) doesn’t give you enough large-cap U.S. equity exposure as a Canadian investor, Invesco NASDAQ 100 Index ETF (QQC) is one of the most...

Leveraged exchange-traded funds (ETFs) substantially increase the potential reward of an investment by affording investors the chance to generate double or triple the returns of...
Are you sure you want to block %USER_NAME%?
By doing so, you and %USER_NAME% will not be able to see any of each other's Investing.com's posts.
%USER_NAME% was successfully added to your Block List
Since you’ve just unblocked this person, you must wait 48 hours before renewing the block.
I feel that this comment is:
Thank You!
Your report has been sent to our moderators for review


Add a Comment
We encourage you to use comments to engage with other users, share your perspective and ask questions of authors and each other. However, in order to maintain the high level of discourse we’ve all come to value and expect, please keep the following criteria in mind:
Enrich the conversation, don’t trash it.
Stay focused and on track. Only post material that’s relevant to the topic being discussed.
Be respectful. Even negative opinions can be framed positively and diplomatically. Avoid profanity, slander or personal attacks directed at an author or another user. Racism, sexism and other forms of discrimination will not be tolerated.
Perpetrators of spam or abuse will be deleted from the site and prohibited from future registration at Investing.com’s discretion.