


Sign up to create alerts for Instruments,
Economic Events and content by followed authors
Free Sign Up Already have an account? Sign In
Please try another search

Value investing is easily one of the most popular ways to find great stocks in any market environment. After all, who wouldn’t want to find stocks that are either flying under the radar and are compelling buys, or offer up tantalizing discounts when compared to fair value?
One way to find these companies is by looking at several key metrics and financial ratios, many of which are crucial in the value stock selection process. Let’s put Advance Auto Parts (NYSE:AAP), Inc. AAP stock into this equation and find out if it is a good choice for value-oriented investors right now, or if investors subscribing to this methodology should look elsewhere for top picks:
A key metric that value investors always look at is the Price to Earnings Ratio, or PE for short. This shows us how much investors are willing to pay for each dollar of earnings in a given stock, and is easily one of the most popular financial ratios in the world. The best use of the PE ratio is to compare the stock’s current PE ratio with: a) where this ratio has been in the past; b) how it compares to the average for the industry/sector; and c) how it compares to the market as a whole.
On this front, Advance Auto Parts has a trailing twelve months PE ratio of 20.29, as you can see in the chart below:
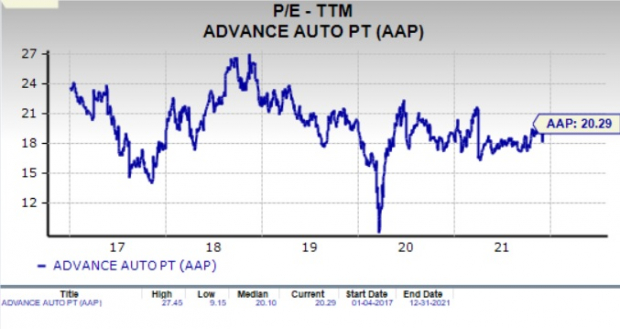
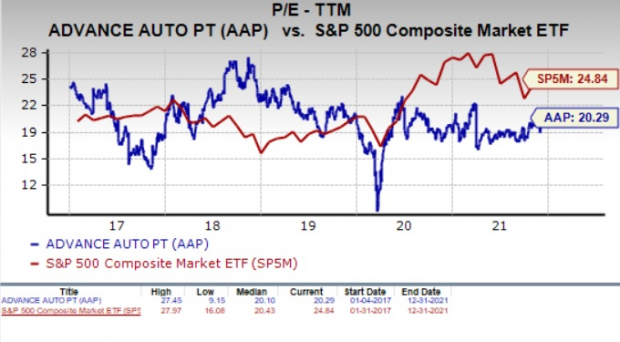
This level actually compares pretty favorably with the market at large, as the PE for the S&P 500 stands at about 24.84. If we focus on the long-term PE trend, Advance Auto Parts’ current PE level puts it above its midpoint over the past five years.
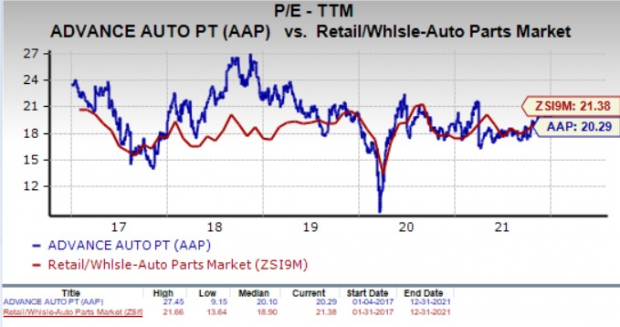
Further, the stock’s PE also compares favorably with the industry’s trailing twelve months PE ratio, which stands at 21.38. At the very least, this indicates that the stock is relatively undervalued right now, compared to its peers.
We should also point out that Advance Auto Parts has a forward PE ratio (price relative to this year’s earnings) of just 20.22, so it is fair to say that a slightly more value-oriented path may be ahead for Advance Auto Parts stock in the near term too.
Another key metric to note is the Price/Sales ratio. This approach compares a given stock’s price to its total sales, where a lower reading is generally considered better. Some people like this metric more than other value-focused ones because it looks at sales, something that is far harder to manipulate with accounting tricks than earnings.
Right now, Advance Auto Parts has a P/S ratio of about 1.39. This is lower than the S&P 500 average, which comes in at 5.16 right now. As we can see in the chart below, this is above the median for this stock in particular over the past few years.
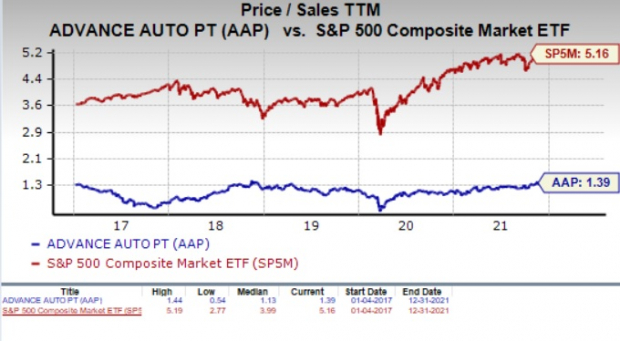
If anything, Advance Auto Parts is towards the higher end of its range in the time period from a P/S metric, which suggests that the company’s stock price has already appreciated to some degree, relative to its sales.
In aggregate, Advance Auto Parts currently has a Zacks Value Style Score of B, putting it into the top 40% of all stocks we cover from this look. This makes Advance Auto Parts a solid choice for value investors, and some of its other key metrics make this pretty clear too.
For example, the PEG ratio for Advance Auto Parts is 1.32, a level that is lower than the industry average of 1.49. The PEG ratio is a modified PE ratio that takes into account the stock’s earnings growth rate. Additionally, its P/CF ratio (another great indicator of value) comes in at 19.44, which is better than the industry average of 20.08. Clearly, AAP is a solid choice on the value front from multiple angles.
Though Advance Auto Parts might be a good choice for value investors, there are plenty of other factors to consider before investing in this name. In particular, it is worth noting that the company has a Growth grade of B and a Momentum score of B. This gives AAP a Zacks VGM score—or its overarching fundamental grade—of A. (You can read more about the Zacks Style Scores here >>)
Meanwhile, the company’s recent earnings estimates have been mixed at best. The current quarter has seen four estimates go higher in the past sixty days compared to two lower, while the full year estimate has seen eight upward and one downward revision in the same time period.
As a result, the current quarter consensus estimate has inched lower by 0.5% in the past two months, while the full year estimate has increased 4.2%.
This somewhat mixed trend is why the stock has just a Zacks Rank #3 (Hold) and why we are looking for in-line performance from the company in the near term.
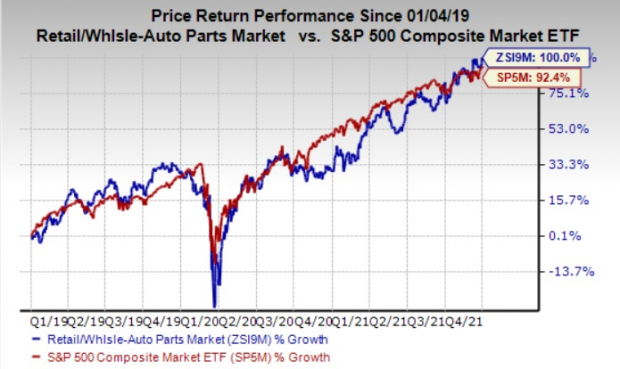
Advance Auto Parts is an inspired choice for value investors, as it is hard to beat its incredible lineup of statistics on this front. Moreover, a strong industry rank (Top 5% out of more than 250 industries) further supports the growth potential of the stock. In fact, over the past three years, the industry has outperformed the broader market, as you can see below:
However, with a Zacks Rank #3, it is hard to get too excited about this company overall. So, value investors might want to wait for estimates and analyst sentiment to turn around in this name first, but once that happens, this stock could be a compelling pick.
Zacks Top 10 Stocks for 2022
In addition to the investment ideas discussed above, would you like to know about our 10 top picks for the entirety of 2022?
From inception in 2012 through November, the Zacks Top 10 Stocks gained an impressive +962.5% versus the S&P 500’s +329.4%. Now our Director of Research is combing through 4,000 companies covered by the Zacks Rank to handpick the best 10 tickers to buy and hold. Don’t miss your chance to get in on these stocks when they’re released on January 3.
Be First To New Top 10 Stocks >>Want the latest recommendations from Zacks Investment Research? Today, you can download 7 Best Stocks for the Next 30 Days. Click to get this free report
Advance Auto Parts, Inc. (AAP): Free Stock Analysis Report
To read this article on Zacks.com click here.
Investors are on edge about what tariff policy means for markets Coming off a strong Q4 earnings season, fresh February corporate sales figures can help assess the macro...
Broadcom stock is in a dynamic rebound phase. Markets seem optimistic ahead of the earnings release. Let's take a deep dive into what to expect from the report. Get the...
Consumers are feeling the pinch from inflation every time they go to the grocery store. Money is a zero-sum game; as disposable income and buying power erodes, consumers are...
Are you sure you want to block %USER_NAME%?
By doing so, you and %USER_NAME% will not be able to see any of each other's Investing.com's posts.
%USER_NAME% was successfully added to your Block List
Since you’ve just unblocked this person, you must wait 48 hours before renewing the block.
I feel that this comment is:
Thank You!
Your report has been sent to our moderators for review
Add a Comment
We encourage you to use comments to engage with other users, share your perspective and ask questions of authors and each other. However, in order to maintain the high level of discourse we’ve all come to value and expect, please keep the following criteria in mind:
Enrich the conversation, don’t trash it.
Stay focused and on track. Only post material that’s relevant to the topic being discussed.
Be respectful. Even negative opinions can be framed positively and diplomatically. Avoid profanity, slander or personal attacks directed at an author or another user. Racism, sexism and other forms of discrimination will not be tolerated.
Perpetrators of spam or abuse will be deleted from the site and prohibited from future registration at Investing.com’s discretion.