


Sign up to create alerts for Instruments,
Economic Events and content by followed authors
Free Sign Up Already have an account? Sign In
Please try another search

A month has gone by since the last earnings report for Invesco Ltd. (NYSE:IVZ) . Shareshave lost about 11.7% in the past month, underperforming the market.
Will the recent negative trend continue leading up to its next earnings release, or is IVZ due for a breakout? Before we dive into how investors and analysts have reacted as of late, let's take a quick look at its most recent earnings report in order to get a better handle on the important drivers.
Invesco Beats Q4 Earnings as Revenues and AUM Rise
Invesco reported fourth-quarter 2017 adjusted earnings of 73 cents per share, outpacing the Zacks Consensus Estimate of 70 cents. Also, the bottom line came in 23.7% higher than the prior-year quarter.
Results were primarily supported by higher revenues and long-term net inflows. Further, the company reported a rise in assets under management (AUM). However, increase in operating expenses was an undermining factor.
On a GAAP basis, net income attributable to common shareholders came in at $408.2 million or 99 cents per share, up from $226.5 million or 55 cents per share a year ago.
For 2017, adjusted earnings per share of $2.70 beat the Zacks Consensus Estimate of $2.67 and were up 21.1% year over year. On a GAAP basis, net income attributable to common shareholders was $1.13 billion, up 32% from last year.
Revenues Rise Modestly, Expenses Up
GAAP operating revenues for the quarter were $1.38 billion, up 15.1% year over year. The figure marginally topped the Zacks Consensus Estimate of $1.37 billion. Adjusted net revenues increased 16.3% year over year to $1 billion.
For 2017, GAAP operating revenues for the quarter were $5.16 billion, up 9% year over year but lagged the Zacks Consensus Estimate of $5.21 billion. Adjusted net revenues grew 10.7% year over year to $3.75 billion.
Adjusted operating expenses were $605.7 million, up 14.8% from the prior-year quarter. The rise was due to an increase in all expense components.
Adjusted operating margin for the quarter was 39.7% compared with 38.9% a year ago.
Strong AUM
As of Dec 31, 2017, AUM grew 15.3% year over year to $937.6 billion. Average AUM for the reported quarter totaled $930.3 billion, up 15% from the year-ago quarter. Further, the reported quarter witnessed long-term net inflows of $4.4 billion.
Outlook
The company expects to witness an organic growth rate of 3% to 5% in the near future, driven by better flow consistency and business diversification.
Management expects net revenue yield (excluding performance fees) in 2018 to decline 0.5 basis points (bps) year over year to nearly 41 bps. This will be attributable to the acquisition of ETF business (Source and Guggenheim), which will be dilutive to the net revenue yield by 1.5 bps. These will be partially offset by improving foreign exchange rates and sales mix trends.
Moreover, in 2018, performance fees are projected to be around $10-$15 million per quarter and adjusted other revenues to be in the range of $16-$17 million on a quarterly basis.
On the cost front, management expects compensation expenses to be roughly $410-$415 million per quarter. First-quarter 2018 will include the seasonality of payroll taxes, one-month impact from the base salary increases and the impact of higher foreign exchange. Notably, seasonal taxes will then drop in the second quarter, but will include expenses related to the Guggenheim ETF business and variable compensation.
On a quarterly basis in 2018, the company expects market expenses to be nearly $32 million, property, office and technology costs to be in range of $102-$104 million (on par with the fourth- quarter 2017 level) and G&A expenses to be in the range of $80-$83 million.
Based on the above-mentioned guidance and expecting flat markets and foreign exchange, management expects incremental margin target for 2018 at the 40% to 50% level. For 2019 and beyond, the company anticipates incremental margin to be in the 50% to 65% level, mainly driven by revenue growth.
Management expects effective tax rate in 2018 to be 20-21%.
How Have Estimates Been Moving Since Then?
In the past month, investors have witnessed a downward trend in fresh estimates. There have been three revisions lower for the current quarter.
VGM Scores
At this time, IVZ has an average Growth Score of C, a grade with the same score on the momentum front. Following the exact same course, the stock was also allocated a grade of C on the value side, putting it in the middle 20% for this investment strategy.
Overall, the stock has an aggregate VGM Score of B. If you aren't focused on one strategy, this score is the one you should be interested in.
Based on our scores, the stock is equally suitable for value, growth, and momentum investors.
Outlook
Estimates have been broadly trending downward for the stock and the magnitude of these revisions indicates a downward shift. Notably, IVZ has a Zacks Rank #2 (Buy). We expect an above average return from the stock in the next few months.
Shares of Caesars Entertainment (NASDAQ:CZR), a leading gambling stock, traded around 3% higher on Wednesday morning, though the stock was trading around 1.5% lower shortly before...
Amazon (NASDAQ:AMZN) is making a significant push into the future with a robust investment in robotics and artificial intelligence. The company has earmarked $35 billion for...
Home Depot’s (NYSE:HD) Q4 2024 report and guidance for 2025 have plenty to be unhappy about, but the simple truth is that this company turned a corner in 2024. It is on track for...
Are you sure you want to block %USER_NAME%?
By doing so, you and %USER_NAME% will not be able to see any of each other's Investing.com's posts.
%USER_NAME% was successfully added to your Block List
Since you’ve just unblocked this person, you must wait 48 hours before renewing the block.
I feel that this comment is:
Thank You!
Your report has been sent to our moderators for review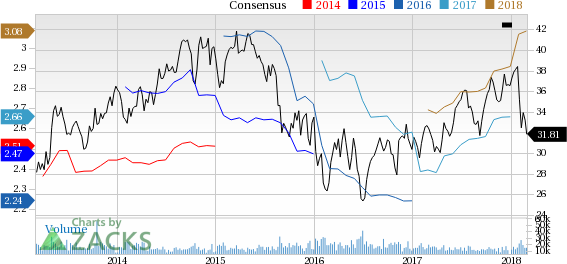

Add a Comment
We encourage you to use comments to engage with other users, share your perspective and ask questions of authors and each other. However, in order to maintain the high level of discourse we’ve all come to value and expect, please keep the following criteria in mind:
Enrich the conversation, don’t trash it.
Stay focused and on track. Only post material that’s relevant to the topic being discussed.
Be respectful. Even negative opinions can be framed positively and diplomatically. Avoid profanity, slander or personal attacks directed at an author or another user. Racism, sexism and other forms of discrimination will not be tolerated.
Perpetrators of spam or abuse will be deleted from the site and prohibited from future registration at Investing.com’s discretion.