Breaking News
Get 45% Off 0
🚨 Don’t miss your updated list of AI-picked stocks for this month
Pick Stocks with AI

Indicators Indicate 'Wait And See'

By Market OverviewSep 05, 2012 12:44PM ET
www.investing.com/analysis/indicators-indicate-'wait-and-see'-135332
Indicators Indicate 'Wait And See'
By   |  Sep 05, 2012 12:44PM ET
Saved. See Saved Items.
This article has already been saved in your Saved Items
 
 
DJI
+1.39%
Add to/Remove from Watchlist
Add to Watchlist
Add Position

Position added successfully to:

Please name your holdings portfolio
 
BARC
+3.40%
Add to/Remove from Watchlist
Add to Watchlist
Add Position

Position added successfully to:

Please name your holdings portfolio
 
SCOP
-0.50%
Add to/Remove from Watchlist
Add to Watchlist
Add Position

Position added successfully to:

Please name your holdings portfolio
 
BMAm
+1.36%
Add to/Remove from Watchlist
Add to Watchlist
Add Position

Position added successfully to:

Please name your holdings portfolio
 
DBC
-0.77%
Add to/Remove from Watchlist
Add to Watchlist
Add Position

Position added successfully to:

Please name your holdings portfolio
 
COMIN
0.00%
Add to/Remove from Watchlist
Add to Watchlist
Add Position

Position added successfully to:

Please name your holdings portfolio
 

September was heralded as the month of decision, and it is right to say that we are almost there, but not yet. Until decisions have been made, gauging the market requires using an internal scope to see how the intermarkets are playing out. The ECB congregates Thursday, and there seems to be some hope that, as limited as it may be, they will make some provisions. The semantics of short term lending and its legality have been thrown around, as well as the ambitions of an unlimited bond buying program. Whatever is to come from Europe is still unknown, but what we do know is that Germany will have its say in the matter.

The Federal Reserve is similarly in the process of triggering QE3 or not. Many believe that the next few weeks of economic data will play a deciding role in the decision, but that may be too rudimentary in thought. Considering stimulus will inevitably lead to price inflation, Bernanke may hold off on directly hitting the consumer. With the fragility of the Middle East and inflation seen in agriculture, the Fed may deem this an inappropriate time to weaken the dollar. The possibility of some other form of obscure easing could also be on the horizon.
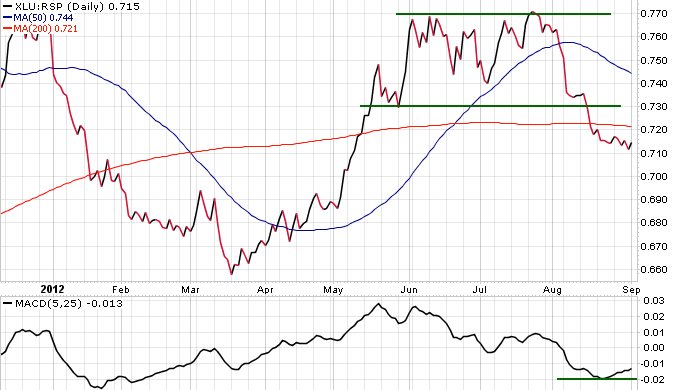
Dividend Index
A theme seen throughout the latest rally was the demand of dividend paying instruments. With the seemingly yield-less government debt and fear of risk in particular assets, safer dividend plays were all the rage. The indicator below is that of a select dividend index (DVY) over an equal weighted market index (RSP). What is seen from the ratio is that dividends outperformed throughout most of the rally. This is a sign of defensive sentiment, but later on it saw a steep decline. That sense of waning risk aversion was fairly bullish, but the indicator looks to be consolidating. This is expected prior to market moving releases, similar to what we will be seeing shortly, and could mean pullbacks or further slothfulness from markets.

DVY:RSP
DVY:RSP

Spain
A fairly positive trend developing is Spanish equities leading world markets. Many of the decisions to be made by the ECB are due to deterioration of confidence in Spain. As confidence falls, their yields appreciate. The indicator below is that of Spanish equities (EWP) over world equity (VT). There has been a solid run up in the price action throughout the last half of the rally, and a slight consolidation as of late. The slight breakout seen below signals confidence that Spain may be better off than once thought. The duration of its current move relies directly on what the ECB decides in following weeks, but this indicator seems to be pointing towards relief in yields.
EWP:VT
EWP:VT

The last macro heavy indicator is that of commodities (DBC) over 20+ year treasuries (TLT). This indicator leads in a stimulatory/inflationary environment, the one in which most market participants hope to see shortly. Whether it is the ECB, Fed, or PBOC that pulls the trigger; this indicator will uptrend. As can be seen, there has been a slight recess in the action recently. Both the price action and MACD have pulled back, but this can be attributed to various factors. The main factor that is trying to be highlighted here, however, is that a risk on environment should trigger upward mobility. Another insight is that this indicator has some room to move lower without breaking any major trend lines. Look for this move lower in following days prior to decisive action.
DBC:TLT
DBC:TLT

Obscure Indicators
Moving into the realm of a more equity centric point of view, we turn to a few obscure indicators. The first one is the S&P 500 number of issues above their 50 day MA over treasuries. This indicator shows the short term strength of equity markets. As can be seen below this indicator is fairly volatile and has recently receded off of its trend line. This is not to call for a pullback, rather to show that the upward strength is not currently present. Further developments should propel this indicator in a more definitive direction.
S&P:50-DMA
S&P:50-DMA

The longer term outlook is shown below in equities. This indicator is that of equities over their 200 day MA's compared to treasuries. This indicator is less volatile and looks to be slightly retracing. It showed strength towards the end of the last rally, but is pulling back before either moving higher, or regressing into the rectangle.
S&P:200-DMA
S&P:200-DMA

Volatility Indicator
The last indicator is a volatility measure. When markets are volatile and VIX (VXX) is active, utility stocks (XLU) outperform the broader market. This indicator has seen a breakout lower, but is somewhat bottoming at its current levels. There could be a move back up to the rectangle or simply a sideways move. Whatever is the case, strength in this indicator indicates volatility in broader markets.
XLU
XLU

The magnitude of charts is needed at due to a seeming lack of headlines influencing markets. We are at a wait-and-see moment and these indicators confirm that.

Indicators Indicate 'Wait And See'
 

Related Articles

Indicators Indicate 'Wait And See'

Add a Comment

Comment Guidelines

We encourage you to use comments to engage with other users, share your perspective and ask questions of authors and each other. However, in order to maintain the high level of discourse we’ve all come to value and expect, please keep the following criteria in mind:  

  •            Enrich the conversation, don’t trash it.

  •           Stay focused and on track. Only post material that’s relevant to the topic being discussed. 

  •           Be respectful. Even negative opinions can be framed positively and diplomatically. Avoid profanity, slander or personal attacks directed at an author or another user. Racism, sexism and other forms of discrimination will not be tolerated.

  • Use standard writing style. Include punctuation and upper and lower cases. Comments that are written in all caps and contain excessive use of symbols will be removed.
  • NOTE: Spam and/or promotional messages and comments containing links will be removed. Phone numbers, email addresses, links to personal or business websites, Skype/Telegram/WhatsApp etc. addresses (including links to groups) will also be removed; self-promotional material or business-related solicitations or PR (ie, contact me for signals/advice etc.), and/or any other comment that contains personal contact specifcs or advertising will be removed as well. In addition, any of the above-mentioned violations may result in suspension of your account.
  • Doxxing. We do not allow any sharing of private or personal contact or other information about any individual or organization. This will result in immediate suspension of the commentor and his or her account.
  • Don’t monopolize the conversation. We appreciate passion and conviction, but we also strongly believe in giving everyone a chance to air their point of view. Therefore, in addition to civil interaction, we expect commenters to offer their opinions succinctly and thoughtfully, but not so repeatedly that others are annoyed or offended. If we receive complaints about individuals who take over a thread or forum, we reserve the right to ban them from the site, without recourse.
  • Only English comments will be allowed.
  • Any comment you publish, together with your investing.com profile, will be public on investing.com and may be indexed and available through third party search engines, such as Google.

Perpetrators of spam or abuse will be deleted from the site and prohibited from future registration at Investing.com’s discretion.

Write your thoughts here
 
Are you sure you want to delete this chart?
 
Post
Post also to:
 
Replace the attached chart with a new chart ?
1000
Your ability to comment is currently suspended due to negative user reports. Your status will be reviewed by our moderators.
Please wait a minute before you try to comment again.
Thanks for your comment. Please note that all comments are pending until approved by our moderators. It may therefore take some time before it appears on our website.
 
Are you sure you want to delete this chart?
 
Post
 
Replace the attached chart with a new chart ?
1000
Your ability to comment is currently suspended due to negative user reports. Your status will be reviewed by our moderators.
Please wait a minute before you try to comment again.
Add Chart to Comment
Confirm Block

Are you sure you want to block %USER_NAME%?

By doing so, you and %USER_NAME% will not be able to see any of each other's Investing.com's posts.

%USER_NAME% was successfully added to your Block List

Since you’ve just unblocked this person, you must wait 48 hours before renewing the block.

Report this comment

I feel that this comment is:

Comment flagged

Thank You!

Your report has been sent to our moderators for review
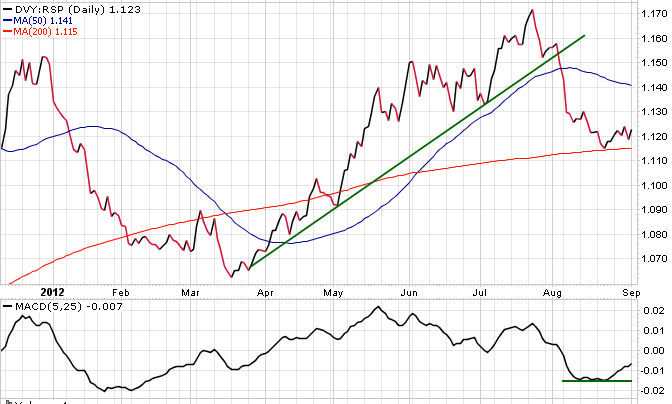
Continue with Apple
Continue with Google
or
Sign up with Email