
- All Instrument Types
- Indices
- Equities
- ETFs
- Funds
- Commodities
- Currencies
- Crypto
- Bonds
- Certificates
Please try another search

How It Started. How It’s Going – Stock Market (and Sentiment Results)…

On Tuesday I joined Charles Payne on Fox Business to discuss 3 turnaround stocks we own and why we own them. Thanks to Charles, Kayla Arestivo and Nick Palazzo for having me on:
Monday I joined Julie Hyman on Yahoo! Finance to discuss one stock we own at these levels and one we want to avoid. Thanks to Julie and Sydnee Fried for having me on:
Watch in HD directly on Yahoo! Finance
Last night I joined Phil Yin on CGTN America to discuss the Fed Decision and implications for the Stock Market moving forward. Thanks to Phil and Mona Zughbi for having me on:
And finally, I joined Maria Katarina on CNBC “Closing Bell” Indonesia this morning to discuss the Fed’s Dovish Pivot and implications moving forward. Thanks to Maria and Fitria Anggrayni for having me on:
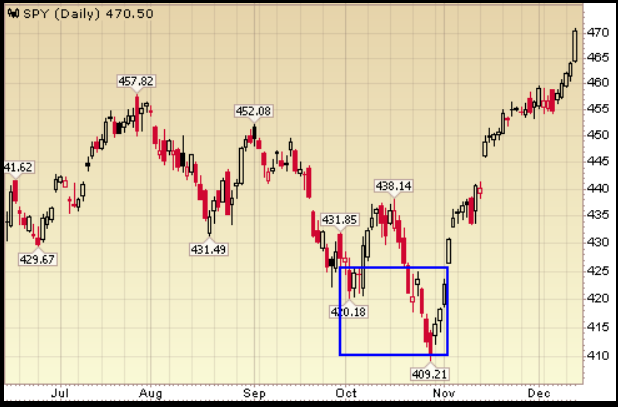
Here’s what the stock market looked like in October (blue box):
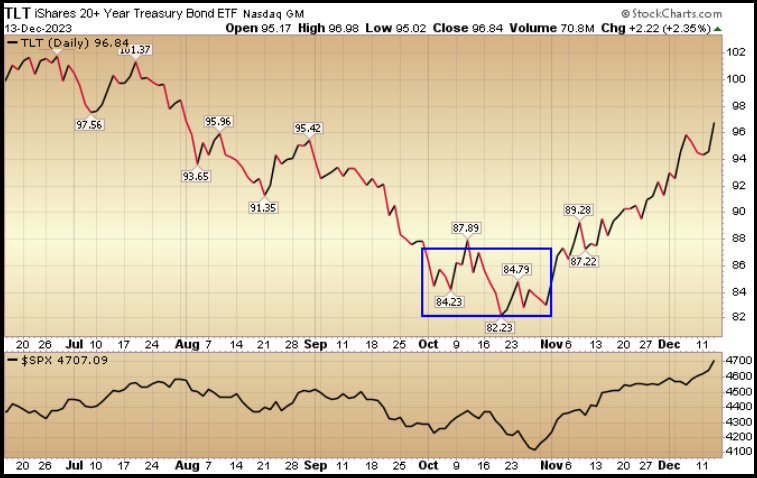
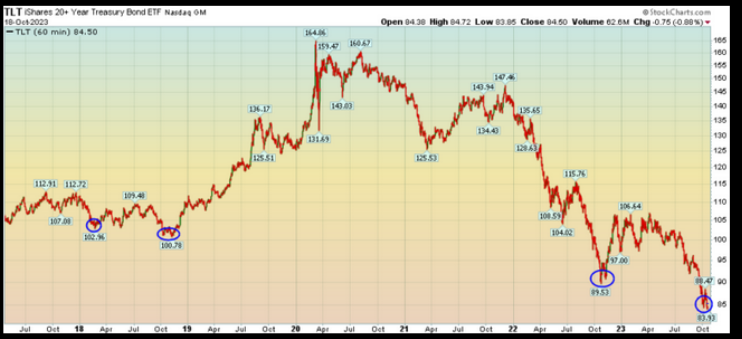
Here’s what the bond market looked like in October (blue box):
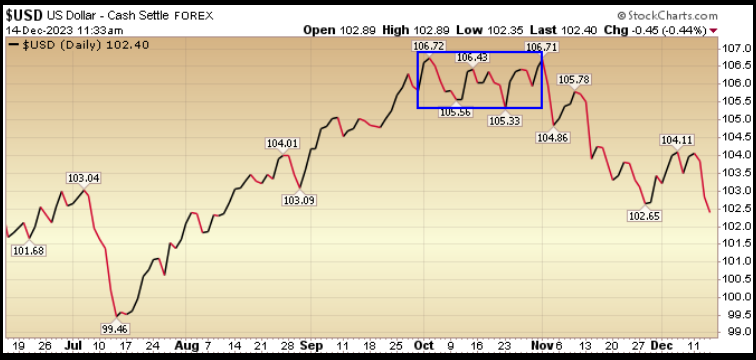
Here’s what the US Dollar looked like in October (blue box):
Here’s what we were doing and publishing when all of the bears were out in full force:
1) September 21 –
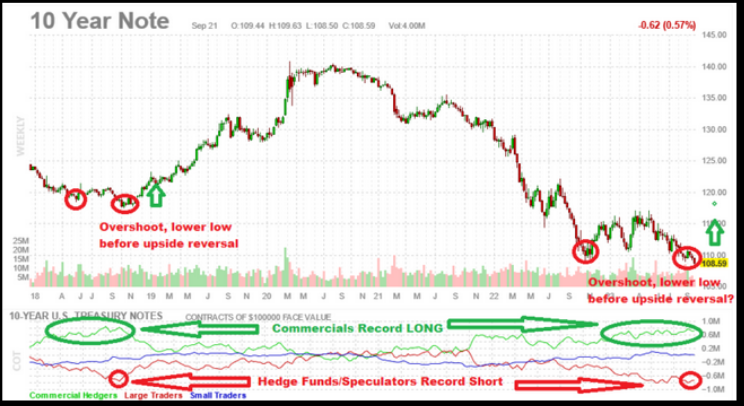
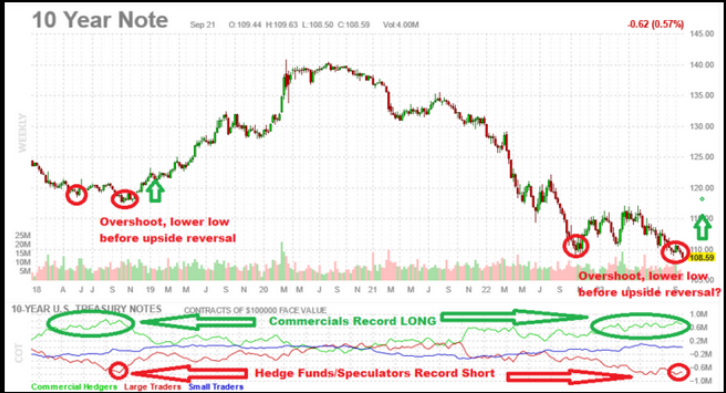
As it relates to this outlook, these are the two most important charts to watch in coming weeks :
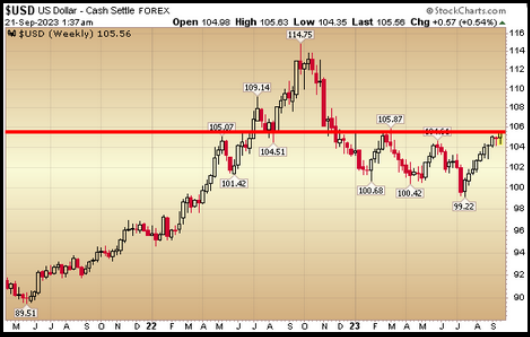
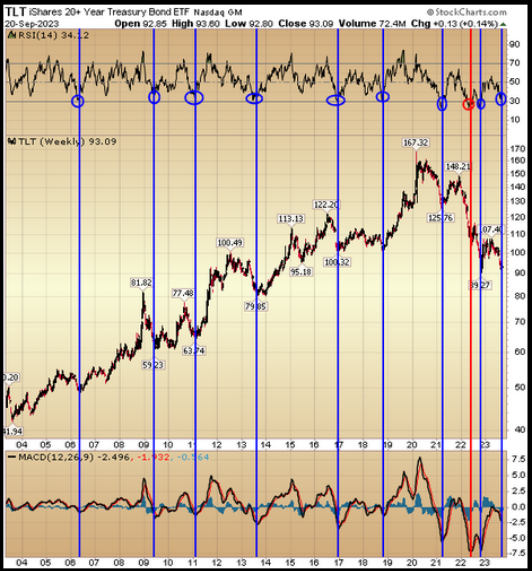
If past is any prologue, we could see an "overshoot" before a reversal like in 2018:
2) September 28 –
"Is it really different this time?" Stock Market (and Sentiment Results)...
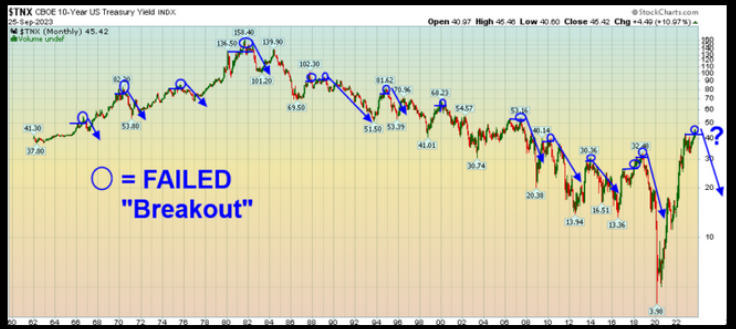
I wouldn't make that bet. Despite 10 year yields breaking above the dreaded 4.50% level, history shows - at least 11x since 1960 that many of the "breakouts" in yields wind up actually being "fake outs" in yields. Don't buy the hype...
For everyone shorting bonds in the hole, keep in mind that buying "breakouts" (in yields) doesn't always end well...
3) October 19-
"The Only Chart That Matters" Stock Market (and Sentiment Results)...
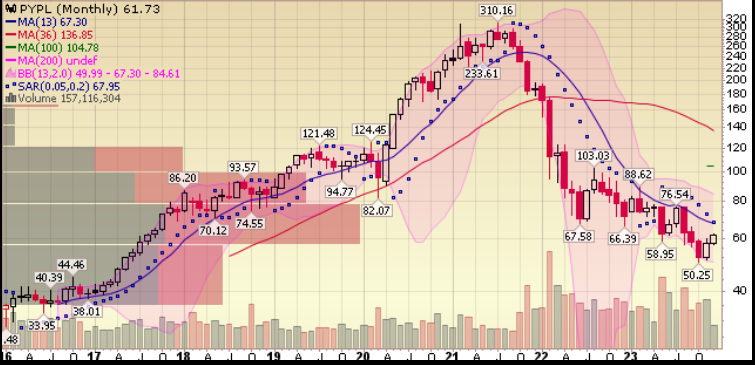
PayPal (NASDAQ:PYPL) Update
Also in the final article above, I laid out out case for why we own PayPal. It was trading at $51.40 that day. They have since reported results so I want to update the thesis:
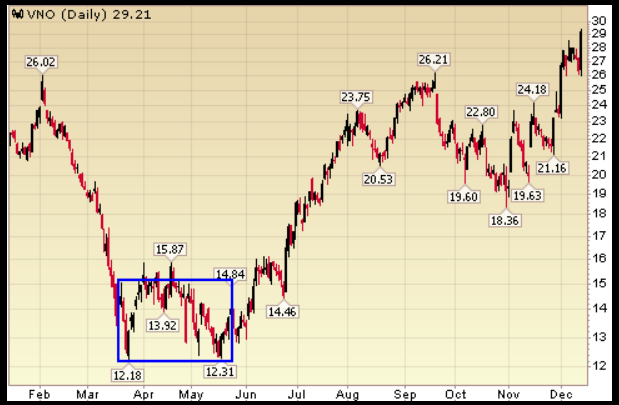
Remember Vornado at ~$15?
Here’s a clip from April 20:
Here’s what happened next:
Now onto the shorter term view for the General Market:
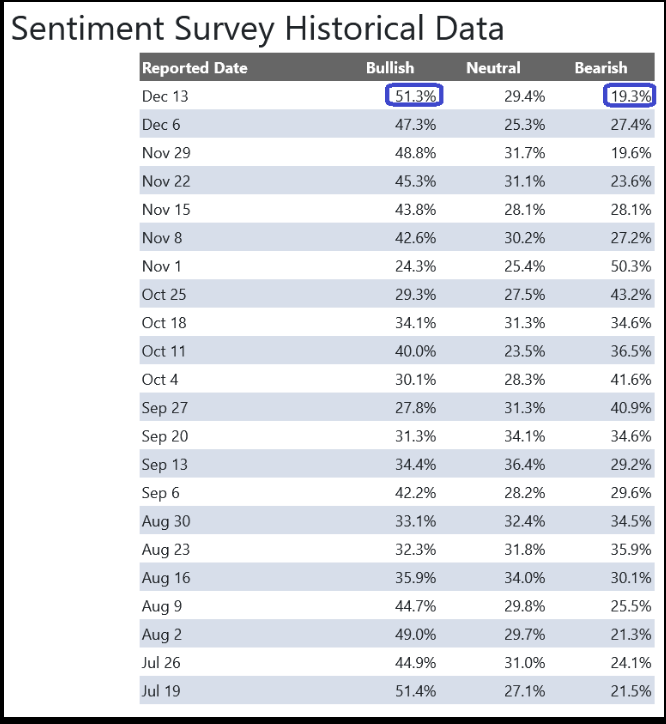
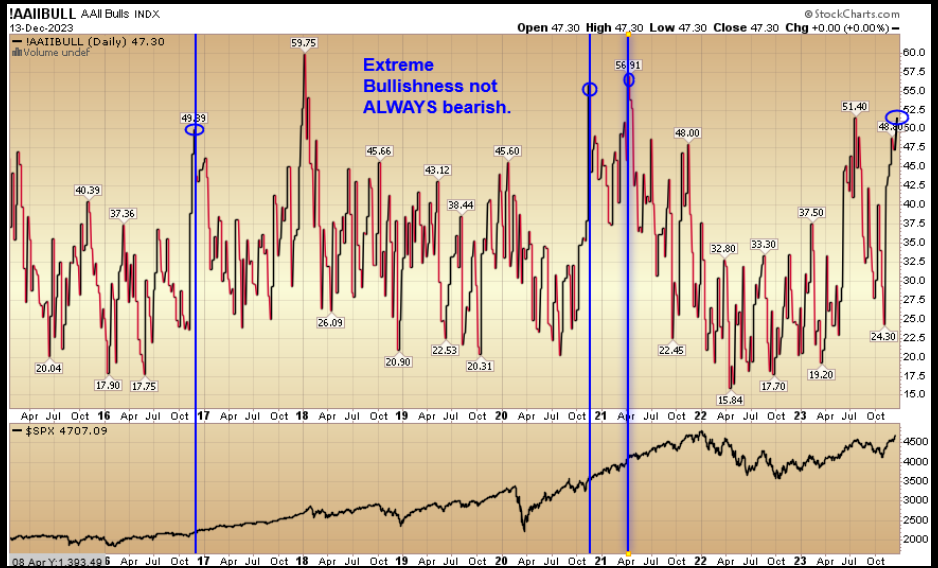
In this week’s AAII Sentiment Survey result, Bullish Percent (Video Explanation) moved up to 51.3% from 47.3% the previous week. Bearish Percent dropped to 19.3% from 27.4%. Retail investors are bullish. This level can stay elevated during major moves (see below).
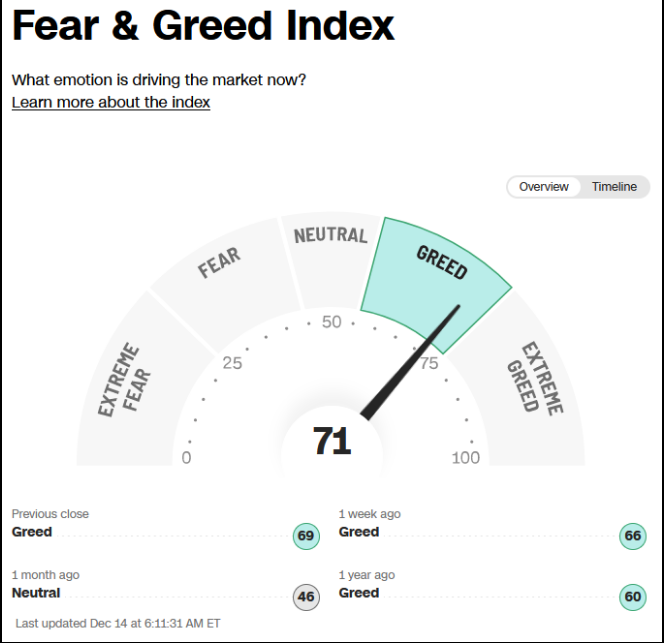
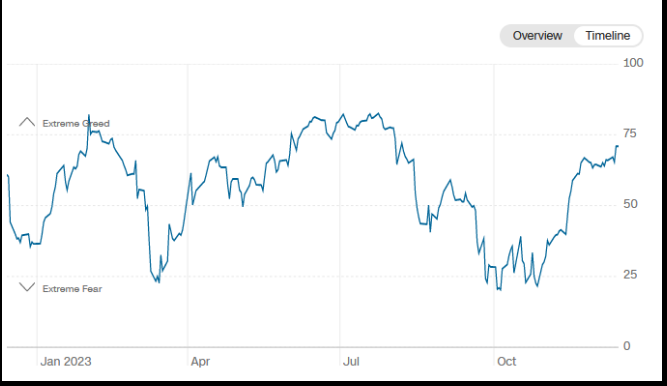
The CNN “Fear and Greed” moved up from 63 last week to 71 this week. By this metric, investors are giddy, but not yet euphoric. You can learn how this indicator is calculated and how it works here: (Video Explanation)
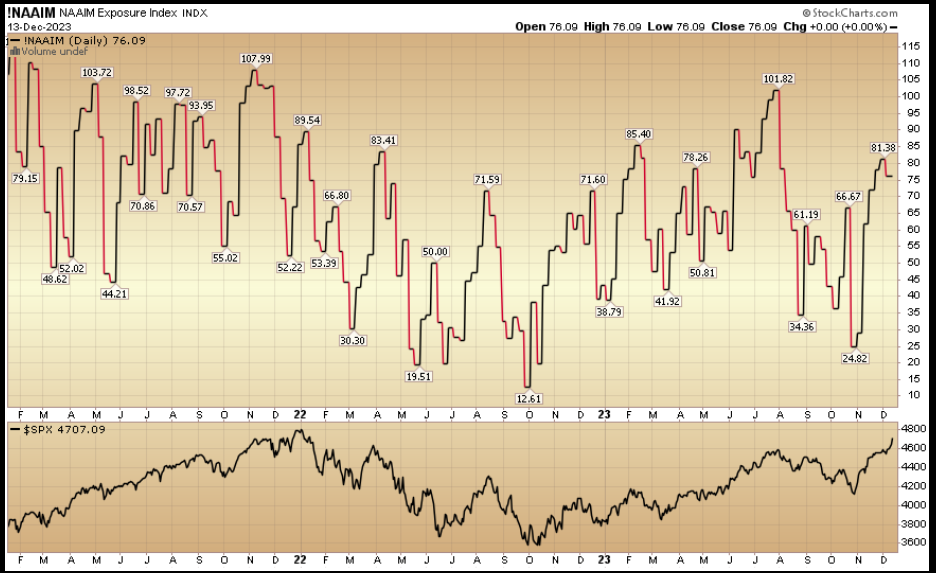
And finally, the NAAIM (National Association of Active Investment Managers Index) (Video Explanation) moved down to 76.09% this week from 81.38% equity exposure last week ago. The year end chase is not over:
This content was originally published on Hedgefundtips.com.
Related Articles

MON: Eurogroup Meeting, Norwegian CPI (Feb), EZ Sentix Index (Mar), Japanese GDP (Q4) TUE: EIA STEO WED: 25% US tariff on all imports of steel and aluminium comes into effect,...

Brief Reminder In 2018, US President Donald Trump initiated a trade war update with sanctions against China. Economic disagreement between the United States and China began in...

Trump’s U-Turns Keep the Market Under Pressure Both US equity indices and the US dollar remain under severe stress as US President Trump continues his back-and-forth on the...
Are you sure you want to block %USER_NAME%?
By doing so, you and %USER_NAME% will not be able to see any of each other's Investing.com's posts.
%USER_NAME% was successfully added to your Block List
Since you’ve just unblocked this person, you must wait 48 hours before renewing the block.
I feel that this comment is:
Thank You!
Your report has been sent to our moderators for review



Add a Comment
We encourage you to use comments to engage with other users, share your perspective and ask questions of authors and each other. However, in order to maintain the high level of discourse we’ve all come to value and expect, please keep the following criteria in mind:
Enrich the conversation, don’t trash it.
Stay focused and on track. Only post material that’s relevant to the topic being discussed.
Be respectful. Even negative opinions can be framed positively and diplomatically. Avoid profanity, slander or personal attacks directed at an author or another user. Racism, sexism and other forms of discrimination will not be tolerated.
Perpetrators of spam or abuse will be deleted from the site and prohibited from future registration at Investing.com’s discretion.