


Sign up to create alerts for Instruments,
Economic Events and content by followed authors
Free Sign Up Already have an account? Sign In
Please try another search

The third-quarter earnings have drawn to a close for the airline companies. Notably, most carriers have managed to surpass estimates in the reported period, despite back-to-back natural calamities, primarily owing to reduced expectations.
However, the broader scenario does not seem so bright for the companies with earnings having declined massively on a year-over-year basis.
Q3 Results
The third quarter of 2017 saw major airline companies like Delta Air Lines, Inc. (NYSE:DAL) , Southwest Airlines Co. (NYSE:LUV) , American Airlines Group, Inc. (NASDAQ:AAL) and United Continental Holdings, Inc. (NYSE:UAL) topping earnings estimates.
However, earnings decreased on a year-over-year basis due to higher costs. At Delta Air Lines and Southwest Airlines, the bottom line declined 7.6% and 5.4%, respectively, while at United Continental, the metric decreased 28.6%. American Airlines too reported a significant reduction in earnings in the quarter.
The hurricanes have significantly disrupted operations of the airlines. The multiple flight cancellations as well as continued soft demand for air travel to and from the affected areas due to Hurricane Harvey have hampered the companies’ top line.
Southwest Airlines’ Passenger revenues per available seat mile (PRASM: a key measure of unit revenues) slid 1.4%, while RASM (revenues per available seat mile) was down 0.5% year over year.
United Continental’s top line also slipped 0.4% on a year-over-year basis in the quarter. This Zacks Rank #3 (Hold) company, which had to cancel 8,300 flights in the quarter under review due to weather-related disturbances, reported a 3.7% fall in PRASM. You can see the complete list of today’s Zacks #1 Rank (Strong Buy) stocks here.
High Costs Hitting Airlines
Persistent high costs pertaining to fuel and labor have been hurting the bottom-line growth of airline stocks for quite some time now.
Further, adding to the woes, Harvey contributed to an increase in oil prices. Higher fuel prices are expected to limit the earnings growth of the carriers in the fourth quarter as well.
Also, with most carriers inking multiple labor deals, such costs have been on a rise of late. In fact this downside has been denting the earnings picture for the airlines over the past few quarters and the fourth quarter is likely to be no exception.
Bearish Q4 and Full-Year View
Several airline companies have provided a grim outlook for the final quarter of 2017 as well as the full year. United Continental expects consolidated PRASM to decline between 1% and 3% (year over year) in the fourth quarter of 2017. In addition, the company anticipates unit costs (excluding Fuel, Profit Sharing & Third Party business costs) to increase in the band of 2.5-3.5% due to higher labor and fuel costs. Average fuel price per gallon (consolidated) is projected between $1.80 and $1.85.
For the fourth quarter of 2017, JetBlue Airways Corp. (NASDAQ:JBLU) expects consolidated operating cost per available seat mile (excluding fuel) to grow in the band of 5-7%. For 2017, the metric is projected to grow in the 4-5% range. RASM is anticipated to grow in the range of (3%) to 0% on a year-over-year basis.
Spirit Airlines, Inc. (NASDAQ:SAVE) anticipates total revenues per available seat mile (TRASM) to decline 4-6% in the fourth quarter.
Hawaiian Holdings, Inc. (NASDAQ:HA) predicts CASM (cost per available seat mile), excluding fuel, to rise significantly for the ongoing quarter, primarily due to higher labor costs. Fuel cost per gallon (economic) is anticipated in the range of $1.75-$1.85 for the fourth quarter, whereas the metric is expected in the $1.65-$1.75 band for 2017.
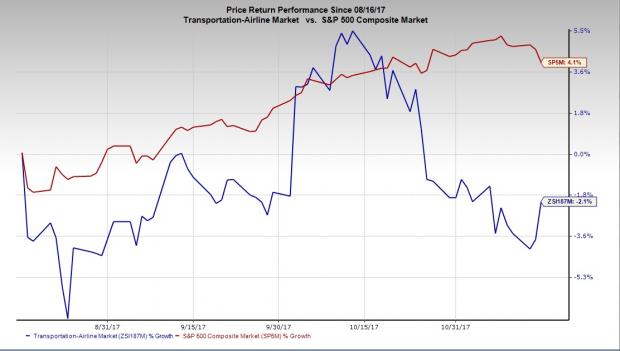
Price Performance
The dull outlook for the airlines is evident from the fact that the Zacks Airline Industry has underperformed the broader market in the last three months. While the S&P 500 Index has gained 4.1%, the industry has declined 2.1%.
Zacks Industry Rank Denotes the Drab Scenario
The Zacks Industry Rank of 201 (of 250 plus groups) carried by the Zacks Airline industry further highlights the woes of the airlines. This unfavorable rank places the companies in the bottom 21% of the Zacks industries.
We classify our entire 250-plus industries into two groups: the top half (i.e. industries with the best average Zacks Rank) and the bottom half (the industries with the worst average Zacks Rank).
Using a week’s rebalance for over 10 years now, the top half has been beating the bottom half by a factor of more than 2 to 1.
Click here to know more: About Zacks Industry Rank
Zacks’ Best Private Investment Ideas
While we are happy to share many articles like this on the website, our best recommendations and most in-depth research are not available to the public.
Starting today, for the next month, you can follow all Zacks' private buys and sells in real time. Our experts cover all kinds of trades… from value to momentum . . . from stocks under $10 to ETF and option moves . . . from stocks that corporate insiders are buying up to companies that are about to report positive earnings surprises. You can even look inside exclusive portfolios that are normally closed to new investors.
Click here for Zacks' private trades >>
In a striking reversal of fortunes, equities in developed markets ex-US are now leading the major asset classes in 2025 while US shares are posting a modest loss year to date,...
US index futures broke lower after Marvell Technology's earnings missed. Nasdaq and S&P 500 are now testing key support zones. Meanwhile, Amazon, Oracle, Tesla and...
There was some modest buying today from the open, but volume was light and markets are below trading range support established during the latter part of 2024. It's hard to see...
Are you sure you want to block %USER_NAME%?
By doing so, you and %USER_NAME% will not be able to see any of each other's Investing.com's posts.
%USER_NAME% was successfully added to your Block List
Since you’ve just unblocked this person, you must wait 48 hours before renewing the block.
I feel that this comment is:
Thank You!
Your report has been sent to our moderators for review
Add a Comment
We encourage you to use comments to engage with other users, share your perspective and ask questions of authors and each other. However, in order to maintain the high level of discourse we’ve all come to value and expect, please keep the following criteria in mind:
Enrich the conversation, don’t trash it.
Stay focused and on track. Only post material that’s relevant to the topic being discussed.
Be respectful. Even negative opinions can be framed positively and diplomatically. Avoid profanity, slander or personal attacks directed at an author or another user. Racism, sexism and other forms of discrimination will not be tolerated.
Perpetrators of spam or abuse will be deleted from the site and prohibited from future registration at Investing.com’s discretion.