


Sign up to create alerts for Instruments,
Economic Events and content by followed authors
Free Sign Up Already have an account? Sign In
Please try another search

Hewlett Packard Enterprise Company (NYSE:HPE) delivered first-quarter fiscal 2020 non-GAAP earnings of 44 cents per share, beating the Zacks Consensus Estimate by a penny. The reported figure also came in higher than the year-ago number of 42 cents. Moreover, non-GAAP earnings came in at the mid-point of management’s guided range of 42–46 cents.
Despite a better-than-expected bottom-line performance, HPE’s shares depreciated nearly 6% in the extended trading session on Mar 3, as revenues missed the consensus mark. Additionally, the company’s downbeat free cash flow outlook for fiscal 2020 turned investors cautious about its near-term performance.
Macroeconomic Factors Hurt Q1 Revenues
HPE reported net revenues of $6.95 billion, which missed the Zacks Consensus Estimate by 3.5% and declined 8% year on year. On a constant currency basis, revenues fell 7%, year over year. The company blamed weaker server demand due to macroeconomic uncertainties, supply constraint, and ongoing shift to cloud computing.
HPE cited that its supply chain has been disrupted due to the coronavirus outbreak in China. Furthermore, organizations are pushing back their big and expensive technology products due to a slowdown in global economic growth. Additionally, more and more organizations continue to shift to cloud computing owing to their maintenance-free and cost effectiveness compared with standalone servers.
Segment wise, the company registered sales contraction across all its major businesses. The Compute (43% of Q1 net revenues) division’s sales decreased 16% year over year to $3.01 billion thanks to component-supply constraints, North America manufacturing capacity constraint and macroeconomic uncertainty.
Apart from the Compute segment, HPE registered sales declines across its Storage and Financial Services businesses. Revenues from Storage business fell 8% year on year to $1.25 billion. Financial Service revenues were down 7% year over year to $859 million.
Nonetheless, slight year-over-year revenue improvement across the HPC & MCS, Intelligent Edge, and A&PS segments partially offset the negative impact of soft performances in the aforementioned segments. HPC & MCS revenues climbed 6% year over year to $823 million. Revenues at the Intelligent Edge division grew 2% to $720 million during the quarter. A&PS division’s sales inched up 1% year over year to $243 million.
Geographically, Hewlett Packard Enterprise’s revenues in the Americas (40% of revenues) decreased 7% at cc. Also, EMEA (37% of revenues) revenues softened 10% at cc and APJ revenues (23% of revenues) fell 2% at cc.
Operating Results
HPE’s non-GAAP gross margin of 33.2% expanded 210 basis points (bps) on a year-over-year basis, aided by a favorable portfolio mix, HPE Next initiatives, and commodity pricing tailwinds. Notably, for the past few quarters, the company is trying to shift focus to higher margin offerings like Intelligent Edge and Aruba Central Hyperconverged Infrastructure.
Hewlett Packard Enterprise Company Price, Consensus and EPS Surprise
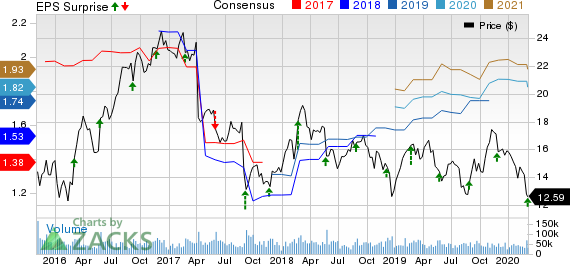
Hewlett Packard Enterprise Company price-consensus-eps-surprise-chart | Hewlett Packard Enterprise Company Quote
HPE’s non-GAAP operating profit fell 10% year over year to $602 million. However, non-GAAP operating margin advanced 10 bps, year over year, to 9.6%, primarily on higher margins of the Intelligent Edge and A&PS businesses.
Balance Sheet and Cash Flow
HPE ended the fiscal first quarter with $3.17 billion in cash and cash equivalents compared with the $3.75 billion recorded at the end of fourth-quarter fiscal 2019.
During the reported period, Hewlett Packard Enterprise used $79 million of cash for operational activities. Free cash flow was also negative $185 million in the quarter.
Additionally, the company repurchased shares worth $204 million and paid out $156 million as dividends.
Guidance
HPE does not expect revenue growth this year due to the coronavirus-led supply-chain disruptions. Notably, during the Security Analyst Meeting last October, HPE had anticipated revenue growth of 1-3% over the next three years.
Furthermore, the company is finding it difficult to quantify the real impact of coronavirus-led demand and supply disruptions. Therefore, management didn’t provide earnings guidance for the fiscal second quarter.
Also, the server maker trimmed its free cash flow outlook to $1.6-$1.8 billion from $1.9-$2.1 billion. However, it reaffirmed the non-GAAP earnings guidance range of $1.78-$1.94 per share.
Zacks Rank & Stocks to Consider
Hewlett Packard Enterprise currently carries a Zacks Rank #5 (Sell).
A few better-ranked stocks in the broader technology sector are Atlassian Corporation PLC (NASDAQ:TEAM) , NVIDIA Corporation (NASDAQ:NVDA) and Akamai Technologies, Inc. (NASDAQ:AKAM) , each carrying a Zacks Rank of 2 (Buy), currently. You can see the complete list of today’s Zacks #1 Rank stocks here.
The long-term earnings growth rate for Atlassian, NVIDIA and Akamai is 22.3%, 12.7% and 12%, respectively.
Today's Best Stocks from Zacks
Would you like to see the updated picks from our best market-beating strategies? From 2017 through 2019, while the S&P 500 gained and impressive +53.6%, five of our strategies returned +65.8%, +97.1%, +118.0%, +175.7% and even +186.7%.
This outperformance has not just been a recent phenomenon. From 2000 – 2019, while the S&P averaged +6.0% per year, our top strategies averaged up to +54.7% per year.
See their latest picks free >>
Through many years of frustration among gold bugs due to the failure of gold stock prices to leverage the gold prices in a positive way, there were very clear reasons for that...
• Trump’s trade war, inflation data, and last batch of earnings will be in focus this week. • DoorDash’s imminent inclusion in the S&P 500 is likely to trigger a wave of...
The big US stocks dominating markets and investors’ portfolios just finished another earnings season. They reported spectacular collective results including record sales, profits,...
Are you sure you want to block %USER_NAME%?
By doing so, you and %USER_NAME% will not be able to see any of each other's Investing.com's posts.
%USER_NAME% was successfully added to your Block List
Since you’ve just unblocked this person, you must wait 48 hours before renewing the block.
I feel that this comment is:
Thank You!
Your report has been sent to our moderators for review
Add a Comment
We encourage you to use comments to engage with other users, share your perspective and ask questions of authors and each other. However, in order to maintain the high level of discourse we’ve all come to value and expect, please keep the following criteria in mind:
Enrich the conversation, don’t trash it.
Stay focused and on track. Only post material that’s relevant to the topic being discussed.
Be respectful. Even negative opinions can be framed positively and diplomatically. Avoid profanity, slander or personal attacks directed at an author or another user. Racism, sexism and other forms of discrimination will not be tolerated.
Perpetrators of spam or abuse will be deleted from the site and prohibited from future registration at Investing.com’s discretion.