


Sign up to create alerts for Instruments,
Economic Events and content by followed authors
Free Sign Up Already have an account? Sign In
Please try another search

A month has gone by since the last earnings report for The Hain Celestial Group, Inc. (NASDAQ:HAIN) . Shares have added about 2.3% in that time frame.
Will the recent positive trend continue leading up to its next earnings release, or is HAIN due for a pullback? Before we dive into how investors and analysts have reacted as of late, let's take a quick look at its most recent earnings report in order to get a better handle on the important catalysts.
Hain Celestial Q2 Earnings Miss by a Penny
The Hain Celestial Group, Inc. concluded second-quarter fiscal 2018 on a dismal note. Both earnings and sales lagged estimates but improved year over year.
The company reported adjusted earnings per share of 41 cents missing the Zacks Consensus Estimate of 42 cents. However, the bottom-line results improved 28.1% year over year. Moreover, on a GAAP basis earnings increased to 45 cents from 26 cents reported in the prior-year quarter.
Net sales increased 5% year over year to $775.2 million coming almost in line with the Zacks Consensus Estimate of $776 million. Rise in sales can primarily be attributed to mid-single digit growth in United Kingdom, Canada and Europe and Hain Pure Protein segments. This was partially negated by low-single digit decline in the United States. The company’s sales increased 2% on a constant currency basis.
Segment Performance
In the reported quarter, net sales at the United States segment dipped 3% year over year to $270.3 million. Net sales in UK and Rest of the World segments rose 12% each to $238.2 million and $107.7 million, respectively. Sales for the Hain Pure Protein segment reflected a gain of 4% in net sales to roughly $159 million.
The company witnessed solid e-commerce sales. In the United States, the company recorded approximately $80 million in net sales. Management anticipates to double or triple the sales in the next two to three years.
Recently, the company announced plans to divest its Hain Pure Protein business to increase efficiencies and simplify brand portfolio. Further, the company continues to focus on 500 SKUs as well as top 11 brands to drive growth. These brands include Terra, Celestial Seasonings, Dream, Earth’s Best, MaraNatha, Imagine, Garden of Eatin', The Greek Gods, Sensible Portions, Spectrum and Alba Botanica.
Gross profits were up 4.3% year over year to $144.3 million. Adjusted operating income surged 21% to $62.1 million, while adjusted operating margin expanded 110 basis points to 8%.
Other Financials
The company ended the quarter with cash and cash equivalents of $139.2 million, long-term debt (excluding current maturities) of nearly $742.1 million, and shareholders’ equity of $1,822.5 million. Cash flow from operating activities was $44.9 million in the quarter compared with $103.3 million as in the prior-year quarter. Capital expenditures were roughly $16.1 million. The company generated operating free cash flow of $28.8 million.
Guidance
Hain Celestial remains committed to its four-point strategic plan, including investment in top brands and capabilities to grow globally; delivering on Terra cost savings and productivity; enhancing leadership to deliver on strategic goals; and returning value to shareholders.
Following second-quarter results, the company adjusted guidance ranges for EBITDA and earnings per share for fiscal 2018 while reiterating net sales projections. For fiscal 2018, the company continues to expect net sales between $2,967 million and $3,036 million, representing growth of 4-6% on a year-over-year basis. Growth in the United States and HPP are projected to be in the range of low to mid-single digit. Meanwhile, UK and the Rest of World segments are projected to witness growth of mid to high-single digits.
Adjusted EBITDA is now projected in the range of $340-$355 million, representing growth of nearly 24-29% year over year, and reflects a $100 million of Project Terra savings and higher brand investment of $40-$50 million primarily in the United States. This reflects a slight decline from the prior guidance range of $350-$375 million.
Cash flow from operations is anticipated in the range of $200-$235 million, while capital expenditure is projected to be $75 million.
The company now projects adjusted earnings per share to be in the range of $1.64-$1.75, including an 8-9 cents gain from the new tax reform and reflecting a 34-43% upside from the prior-year quarter. Earlier, the company had anticipated earnings per share in the range of $1.63-$1.80, up nearly 34-48%.
How Have Estimates Been Moving Since Then?
In the past month, investors have witnessed an upward trend in fresh estimates. There have been five revisions higher for the current quarter.
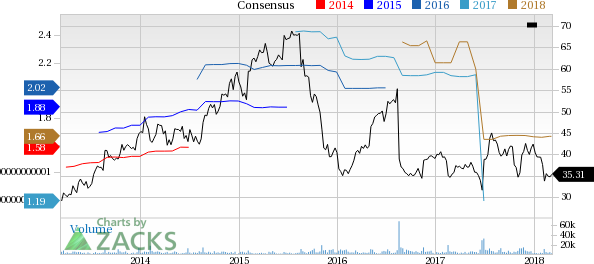
The Hain Celestial Group, Inc. Price and Consensus | The Hain Celestial Group, Inc. Quote
VGM Scores
At this time, HAIN has a nice Growth Score of B, though it is lagging a lot on the momentum front with a D. The stock was allocated a grade of B on the value side, putting it in the second quintile for this investment strategy.
Overall, the stock has an aggregate VGM Score of B. If you aren't focused on one strategy, this score is the one you should be interested in.
Zacks' style scores indicate that the company's stock is suitable for value and growth investors.
Outlook
Estimates have been trending upward for the stock and the magnitude of these revisions looks promising. Notably, HAIN has a Zacks Rank #3 (Hold). We expect an in-line return from the stock in the next few months.
In a market fraught with uncertainty, investors often seek refuge in defensive-minded stocks that offer stability and resilience. Two such stalwarts, Johnson & Johnson and...
Bitcoin has gained legitimacy as it has achieved mainstream status these days. Even the United States Securities and Exchange Commission (SEC) has acknowledged its legitimacy with...
Stocks fell sharply, with the S&P 500 leading the decline, finishing the day down almost 1.6% at 5,860. Meanwhile, the Nasdaq 100 dropped nearly 2.75%, closing at 20,550. This...
Are you sure you want to block %USER_NAME%?
By doing so, you and %USER_NAME% will not be able to see any of each other's Investing.com's posts.
%USER_NAME% was successfully added to your Block List
Since you’ve just unblocked this person, you must wait 48 hours before renewing the block.
I feel that this comment is:
Thank You!
Your report has been sent to our moderators for review
Add a Comment
We encourage you to use comments to engage with other users, share your perspective and ask questions of authors and each other. However, in order to maintain the high level of discourse we’ve all come to value and expect, please keep the following criteria in mind:
Enrich the conversation, don’t trash it.
Stay focused and on track. Only post material that’s relevant to the topic being discussed.
Be respectful. Even negative opinions can be framed positively and diplomatically. Avoid profanity, slander or personal attacks directed at an author or another user. Racism, sexism and other forms of discrimination will not be tolerated.
Perpetrators of spam or abuse will be deleted from the site and prohibited from future registration at Investing.com’s discretion.