


Sign up to create alerts for Instruments,
Economic Events and content by followed authors
Free Sign Up Already have an account? Sign In
Please try another search

Greif, Inc. (NYSE:GEF) reported adjusted earnings of 98 cents per share for fourth-quarter fiscal 2017 (ended Oct 31, 2017), which surged nearly 50.8% year over year. Additionally, earnings surpassed the Zacks Consensus Estimate of 89 cents by a margin of 10%.
Including one-time items, the company posted earnings of 57 cents per share compared to 14 cents per share recorded in the year-ago quarter.
Operational Update
Revenues jumped 11.6% year over year to $968 million from $867.6 million generated in the prior-year quarter. Moreover, revenues surpassed the Zacks Consensus Estimate of $942 million.
Greif Bros. Corporation Price, Consensus and EPS Surprise
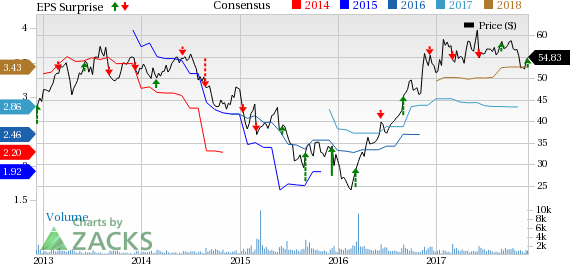
Greif Bros. Corporation Price, Consensus and EPS Surprise | Greif Bros. Corporation Quote
Cost of sales increased 14.8% year over year to $785.7 million. Gross profit declined marginally to $182.4 million from $183.4 million reported in the year-ago quarter. Gross margin contracted 220 basis points (bps) to 18.8% in the quarter. Selling, general and administrative (SG&A) expenses declined 2.4% year over year to $94.2 million. Adjusted operating profit climbed 2.2% year over year to $88.9 million. Adjusted operating margin descended 80 bps to 9.2% in the reported quarter.
Segmental Performance
Rigid Industrial Packaging & Services: The segment reported sales of $662.5 million, up 9.9% from $602.9 million recorded in the comparable quarter last fiscal. Divestitures hurt net sales by $2.5 million, while foreign currency translation benefited net sales by $9.8 million. Adjusted operating profit dropped 13.1% year over year to $52.5 million from $60.4 million.
Paper Packaging: Sales for the segment were up 18% year over year to $223 million, backed by rise in volumes in mills and CorrChoice sheet feeder network, as well as increased sales of specialty products. The segment reported operating profit of $33.7 million, up 36.4% year over year.
Flexible Products & Services: Sales from this segment rose 10.3% year over year to $76.2 million primarily due to strategic pricing decisions. The segment reported adjusted operating profit of $0.6 million against an operating loss of $1.1 million witnessed in the year-earlier quarter.
Land Management: The segment’s sales declined to $6.4 million from $6.6 million recorded in the prior-year quarter due to decrease in timber sales and adverse impact related to hurricane Harvey. Adjusted operating income improved 28.6% year over year to $1.8 million.
Financial Position
Greif ended the fiscal fourth quarter with cash and cash equivalents of $142.3 million compared with $103.7 million as of Oct 31, 2016. Cash provided by operating activities was $199.9 million in the quarter, as compared with $143 million in the year-ago quarter. Long-term debt was $937.8 million as of Oct 31, 2017, compared with $974.6 million as of Oct 31, 2016.
On Dec 5, 2017, Greif announced quarterly dividends of 42 cents per share of Class A Common Stock and 62 cents per share of Class B Common Stock. These dividends are payable on Jan 1, 2018, to shareholders of record at the close of business as of Dec 18, 2017.
Fiscal 2017 Performance
Greif’s earnings climbed 21% year over year to $2.95 per share in fiscal 2017. Earnings also beat the Zacks Consensus Estimate of $2.84. Revenues for the fiscal year came in at $3,368 million, up from $3,324 million recorded in fiscal 2016. However, the top line missed the Zacks Consensus Estimate of $3,612 million.
Guidance
Greif projects its adjusted earnings per share for fiscal 2018 to be in the range of $3.25-$3.55. The company guides its free cash flow for fiscal 2018 to lie between $200 million and $220 million.
Greif anticipates to benefit in fiscal 2018 from transformation initiative. At the end of fiscal 2017 the company has concluded its 3- year transformation initiative. While the transformation may have officially concluded, optimization activities identified during the initiative will continue into 2018.
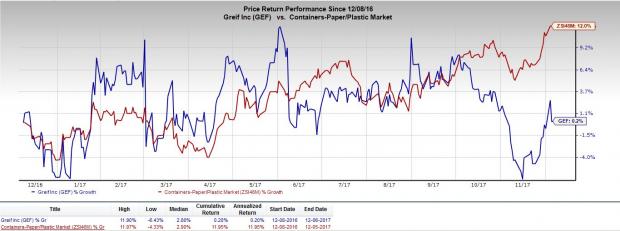
Share Price Performance
Over the past year, Greif has underperformed its industry with respect to price performance. The stock has gained just 0.2%, while the industry has recorded growth of 12% during the same time frame.
Zacks Rank & Key Picks
Greif currently carries a Zacks Rank #4 (Sell).
Some better-ranked stocks in the same space are Caterpillar Inc. (NYSE:CAT) , Deere & Company (NYSE:DE) and Terex Corp. (NYSE:TEX) . All three stocks sport a Zacks Rank of #1 (Strong Buy). You can see the complete list of today’s Zacks #1 Rank stocks here.
Caterpillar has a long-term earnings growth rate of 10.3%. Its shares have been up 51.3%, year to date.
Deere has a long-term earnings growth rate of 8.2%. So far this year, shares of the company have gained 45%.
Terex has a long-term earnings growth rate of 11.3%. The company’s shares have rallied 43.8% during the same time frame.
Zacks' Hidden Trades
While we share many recommendations and ideas with the public, certain moves are hidden from everyone but selected members of our portfolio services. Would you like to peek behind the curtain today and view them?
Starting now, for the next month, I invite you to follow all Zacks' private buys and sells in real time from value to momentum...from stocks under $10 to ETF to option movers...from insider trades to companies that are about to report positive earnings surprises (we've called them with 80%+ accuracy). You can even look inside portfolios so exclusive that they are normally closed to new investors.
Click here for Zacks' secret trade>>
In a market fraught with uncertainty, investors often seek refuge in defensive-minded stocks that offer stability and resilience. Two such stalwarts, Johnson & Johnson and...
Bitcoin has gained legitimacy as it has achieved mainstream status these days. Even the United States Securities and Exchange Commission (SEC) has acknowledged its legitimacy with...
Stocks fell sharply, with the S&P 500 leading the decline, finishing the day down almost 1.6% at 5,860. Meanwhile, the Nasdaq 100 dropped nearly 2.75%, closing at 20,550. This...
Are you sure you want to block %USER_NAME%?
By doing so, you and %USER_NAME% will not be able to see any of each other's Investing.com's posts.
%USER_NAME% was successfully added to your Block List
Since you’ve just unblocked this person, you must wait 48 hours before renewing the block.
I feel that this comment is:
Thank You!
Your report has been sent to our moderators for review
Add a Comment
We encourage you to use comments to engage with other users, share your perspective and ask questions of authors and each other. However, in order to maintain the high level of discourse we’ve all come to value and expect, please keep the following criteria in mind:
Enrich the conversation, don’t trash it.
Stay focused and on track. Only post material that’s relevant to the topic being discussed.
Be respectful. Even negative opinions can be framed positively and diplomatically. Avoid profanity, slander or personal attacks directed at an author or another user. Racism, sexism and other forms of discrimination will not be tolerated.
Perpetrators of spam or abuse will be deleted from the site and prohibited from future registration at Investing.com’s discretion.