


Sign up to create alerts for Instruments,
Economic Events and content by followed authors
Free Sign Up Already have an account? Sign In
Please try another search

It has been about a month since the last earnings report for Fidelity National Information Services, Inc. (NYSE:FIS) . Shares have added about 1.9% in that time frame.
Will the recent positive trend continue leading up to its next earnings release, or is FIS due for a pullback? Before we dive into how investors and analysts have reacted as of late, let's take a quick look at its most recent earnings report in order to get a better handle on the important catalysts.
Fidelity Q4 Earnings Beat Estimates, Revenues Decline
Fidelity’s fourth-quarter 2017 adjusted earnings per share from continuing operations came in at $1.36, surpassing the Zacks Consensus Estimate of $1.34. Also, earnings improved 19.3% from the year-ago quarter figure of $1.14.
Fidelity’s results reflect lower expenses and expanding margin. However, decline in revenues was a headwind.
After considering the net tax benefit from tax legislation of $781 million or $2.32 per share and other adjustments, the company reported net earnings of $988 million or $2.93 in the quarter compared with $207 million or 63 cents in the prior-year quarter.
For full-year 2017, the company reported net earnings attributable to common shareholders of $1.32 billion or $3.93 per share that compares favorably with $568 million or $1.72 per share in the prior year.
Revenues and Expenses Decline
For 2017, the company reported GAAP revenues of $9.12 billion, down 1.3% on a year-over-year basis.
GAAP revenues for the quarter came in at $2.33 billion, which declined 4.7% year over year and lagged the Zacks Consensus Estimate of $2.37 billion.
Organic revenue growth was 3.1% in the quarter.
Selling, general and administrative expenses came in at $340 million, down 26.1% year over year.
Segment wise, Integrated Financial Solutions’ GAAP revenues grew 4.6% year over year to $1.2 billion while revenues from Global Financial Solutions declined 8.5% to $1.05 billion. Corporate/Other revenues decreased 46.5% to $83 million.
Adjusted earnings before interest, tax, depreciation and amortization (EBITDA) rose nearly 4.1% year over year to $881 million while adjusted EBITDA margin expanded 340 basis points to 37.8%.
Balance Sheet & Cash Flow
As of Dec 31, 2017, cash and cash equivalents were $665 million compared with $683 million as of Dec 31, 2016. Debt outstanding was nearly $8.8 billion.
In the quarter, net cash provided by operations was $662 million and free cash flow was $551 million.
Fidelity paid dividends worth $96 million in the quarter and $385 million in 2017.
Guidance for 2018
Fidelity expects organic revenue growth to be in the range of 2.5-3.5% while GAAP revenue growth is expected to decline 1.5-2.5%.
Adjusted earnings per share are expected to be in the band of $5.10-$5.30.
Adjusted EBITDA margin is expected in the range of 36-37%.
Management expects adjusted depreciation and amortization to be in the range of $660-$680 million.
Net interest expenses are expected to come in about $280 million in 2018.
Full-year 2018 effective tax rate is anticipated to be about 20%.
Management expects net minority interest to be about $27 million.
Capital expenditures of about 7% of revenues are likely to be made in 2018.
How Have Estimates Been Moving Since Then?
In the past month, investors have witnessed an upward trend in fresh estimates. There have been two revisions higher for the current quarter.
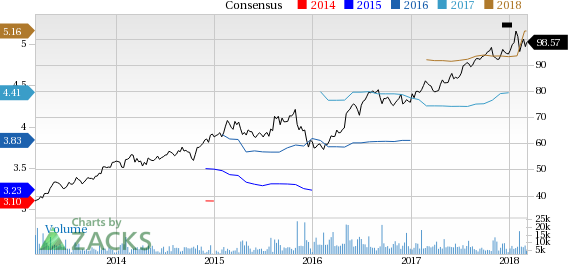
Fidelity National Information Services, Inc. Price and Consensus | Fidelity National Information Services, Inc. Quote
VGM Scores
Currently, FIS has a nice Growth Score of B, a grade with the same score on the momentum front. However, the stock was allocated a grade of D on the value side, putting it in the bottom 40% for this investment strategy.
Overall, the stock has an aggregate VGM Score of C. If you aren't focused on one strategy, this score is the one you should be interested in.
Zacks' style scores indicate that the company's stock is suitable for growth and momentum investors.
Outlook
Estimates have been trending upward for the stock and the magnitude of these revisions looks promising. It comes with little surprise that FIS has a Zacks Rank #2 (Buy). We expect an above average return from the stock in the next few months.
Since the Robotaxi event on October 11th, Tesla (NASDAQ:TSLA) stock is up 38%, currently priced at $291.60 per share This is a return to the early November 2024 price level. But...
The Q4 2024 earnings season tapers off from here, with S&P 500® EPS growth surpassing 17%, the highest in 3 years Large cap outlier earnings dates this week include:...
Shares of Alibaba (NYSE:BABA) are on a tear to start off 2025. The consumer discretionary and tech stock is up by 52% this year as of the Feb. 25 close. The company’s cloud...
Are you sure you want to block %USER_NAME%?
By doing so, you and %USER_NAME% will not be able to see any of each other's Investing.com's posts.
%USER_NAME% was successfully added to your Block List
Since you’ve just unblocked this person, you must wait 48 hours before renewing the block.
I feel that this comment is:
Thank You!
Your report has been sent to our moderators for review
Add a Comment
We encourage you to use comments to engage with other users, share your perspective and ask questions of authors and each other. However, in order to maintain the high level of discourse we’ve all come to value and expect, please keep the following criteria in mind:
Enrich the conversation, don’t trash it.
Stay focused and on track. Only post material that’s relevant to the topic being discussed.
Be respectful. Even negative opinions can be framed positively and diplomatically. Avoid profanity, slander or personal attacks directed at an author or another user. Racism, sexism and other forms of discrimination will not be tolerated.
Perpetrators of spam or abuse will be deleted from the site and prohibited from future registration at Investing.com’s discretion.