Federated Investors, Inc. (NYSE:) and Ameriprise Financial, Inc. (NYSE:) — the two investment managers — have market capitalization of $3.1 billion and $23.3 billion, respectively. Being based in the same region, both companies are influenced by a similar economic environment.
The Zacks Industry Rank is #54 (top 21% of the 250 plus Zacks industries) for the industry, to which these two companies belong to. Our back-testing shows that the top 50% of the Zacks-ranked industries outperforms the bottom 50% by a factor of more than two to one.
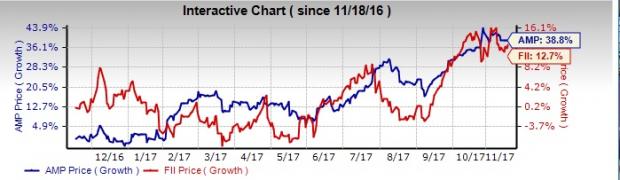
Benefits from a stabilizing economy and gradually improving interest rate scenario have positioned the industry well. In terms of price performance, Federated’s shares have gained 12.7% in the past year, while Ameriprise’s shares have rallied 38.8%.
Though both asset managers have similar business trends, deeper research into the financials will help decide which investment option is better.
FederatedFederated has a trailing 12-month ROE of 34.5% compared with the industry average of 12.9%. This shows the company reinvests its earnings more efficiently.
Further, the stock looks undervalued with respect to its price-to-earnings (P/E) and price-to-cash flow (P/CF) ratios. It has a P/E ratio of 14.28 compared with the average of 19.41. Also, the company’s P/CF of 13.6 is below the S&P 500 average of 13.87.
In addition, Federated’s debt/equity ratio is valued at 0.27 compared to the S&P 500 average of 0.70, indicating a relatively lower debt burden. It highlights the financial stability of the company even in adverse economic conditions. Moreover, its earnings for the current year are projected to be up 5.8%, while sales are likely to record a decline of 3%.
Analysts seem optimistic about the stock’s earnings prospects. Over the last 30 days, Federated has witnessed four upward revisions (against no downward revisions) for 2017. The Zacks Consensus Estimate has moved up 3.4% to $2.15 for the current year.
Federated has a
Value Score of B and
VGM Score of A. Further, the stock carries a Zacks Rank #2 (Buy). Our research shows that stocks with a Value Score and/or VGM Score of A or B, when combined with a Zacks Rank #1 (Strong Buy) or 2 offer the best upside potential.
AmeripriseAmeriprise has a trailing 12-month Return on Equity (ROE) of 29.8% compared with the industry average of 12.9%. This suggests that the company is more efficient in reinvesting its earnings.
However, its debt/equity ratio of 0.82 comes above the S&P 500 average of 0.70. This reflects that the company has a relatively higher debt burden and will not be financially stable during turbulent economic conditions.
Nonetheless, the stock looks undervalued with respect to its P/E and P/CF ratios. It has a forward P/E ratio of 13.11 compared with the S&P 500 average of 19.41. Furthermore, the company’s P/CF of 13.6 is below the S&P 500 average of 13.87.
Additionally, the company’s current-year earnings are projected to rise 27.7%, while sales are estimated to increase 2.1%.
Also, analysts seem optimistic about the stock’s financial performance. For the current year, it witnessed three upward revisions (against no downward revision) over the past month. As a result, the Zacks Consensus Estimate for 2017 has climbed 6% to $12.01.
Ameriprise currently carries a Zacks Rank #2. Also, it has a Value Score of B and a VGM Score of C. You can see
the complete list of today’s Zacks #1 Rank stocks here.Our TakeBoth Federated and Ameriprise look well positioned in terms of ROE, Zacks Rank, undervalued shares and Value Score. Though Ameriprise has better sales growth potential, lower debt burden and favorable VGM Score make Federated a better pick.
Looking for Stocks with Skyrocketing Upside?Zacks has just released a Special Report on the booming investment opportunities of legal marijuana.
Ignited by new referendums and legislation, this industry is expected to blast from an already robust $6.7 billion to $20.2 billion in 2021. Early investors stand to make a killing, but you have to be ready to act and know just where to look.
See the pot trades we're targeting>>AMERIPRISE FINANCIAL SERVICES, INC. (AMP): Free Stock Analysis ReportFederated Investors, Inc. (FII): Free Stock Analysis ReportOriginal post


Add a Comment
We encourage you to use comments to engage with other users, share your perspective and ask questions of authors and each other. However, in order to maintain the high level of discourse we’ve all come to value and expect, please keep the following criteria in mind:
Enrich the conversation, don’t trash it.
Stay focused and on track. Only post material that’s relevant to the topic being discussed.
Be respectful. Even negative opinions can be framed positively and diplomatically. Avoid profanity, slander or personal attacks directed at an author or another user. Racism, sexism and other forms of discrimination will not be tolerated.
Perpetrators of spam or abuse will be deleted from the site and prohibited from future registration at Investing.com’s discretion.