


Sign up to create alerts for Instruments,
Economic Events and content by followed authors
Free Sign Up Already have an account? Sign In
Please try another search

EOG Resources Inc. (NYSE:EOG) reported fourth-quarter 2017 adjusted earnings of 69 cents per share, beating the Zacks Consensus Estimate of 52 cents. The company incurred a loss of 1 cent in the year-ago quarter.
Total revenues in the quarter improved 39% year over year to $3,340 million. Moreover, the top line beat the Zacks Consensus Estimate of $3,026 million.
EOG Resources, Inc. Price, Consensus and EPS Surprise
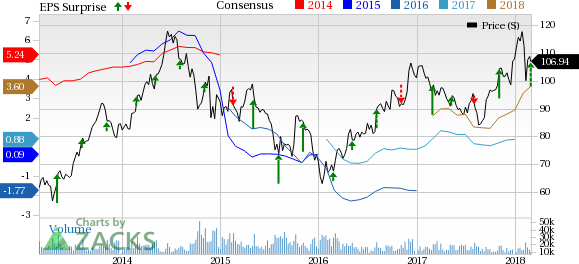
EOG Resources, Inc. Price, Consensus and EPS Surprise | EOG Resources, Inc. Quote
Full-year 2017 earnings of $1.12 per share beat the Zacks Consensus Estimate of 94 cents. The company incurred a loss of $1.61 per share in 2016.
In 2017, total revenues of $11,208.3 million rose from $7,650.6 million in 2016. The figure also surpassed the Zacks Consensus Estimate of $10,870 million.
The strong fourth-quarter 2017 results were supported by higher production and higher oil and gas price realizations.
Dividend
The company’s board of directors increased the cash dividend by 10.4% to 18.5 cents per share. The new dividend payable is effective from Apr 30, 2018, when stockholders of record as of Apr 16, 2018 will be paid.
Operational Performance
In the quarter, EOG Resources’ total volume rose 13.4% year over year to 60.9 million barrels of oil equivalent (MMBoe) and surpassed the Zacks Consensus Estimate of 60 MMBoe.
Crude oil and condensate production in the quarter totaled 368.1 thousand barrels per day (MBbl/d), up 18.1% from the year-ago quarter’s level. Natural gas liquids (NGL) volumes increased 24.4% year over year to 100.6 MBbl/d. Natural gas volumes increased to 1,160 million cubic feet per day (MMcf/d) from the year-earlier quarter’s level of 1,145 MMcf/d.
Average price realization for crude oil and condensates rose 19.3% year over year to $56.97 per barrel and also beat the Zacks Consensus Estimate of $55 per barrel. Quarterly NGL prices surged 45.4% from $18.51 a year ago to $26.92 per barrel and beat the Zacks Consensus Estimate of $22.31. Natural gas was sold at $2.31 per thousand cubic feet (Mcf), up 13.2% year over year and also from Zacks Consensus Estimate of $2.27 per Mcf.
Operating Cost
Total operating cost increased to $2,864.5 million from $2,507.5 million in the year-ago quarter. Exploration expenses declined 41.3% during the quarter, while marketing costs surged 59.2%.
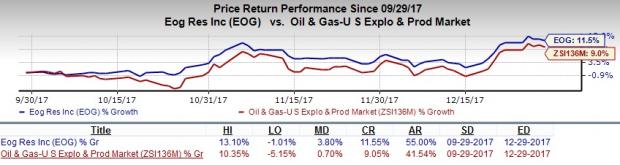
Q4 Price Performance
During the quarter, EOG Resources’ shares gained 11.5% compared with 9% rally of the industry.
Liquidity Position
At the end of the fourth quarter, EOG Resources had cash and cash equivalents of $834.2 million and long-term debt of $6,030.8 million. This represents a debt-to-capitalization ratio of 27%.
During the quarter, the company generated approximately $1,541.7 million in discretionary cash flow compared with $1,045.3 million in the year-ago quarter.
Guidance
For 2018, the company expects crude oil equivalent volumes in the range of 685.8-728.5 thousand barrels of oil equivalent per day. Moreover, the company projects capital budget in the range of $5.4-$5.8 billion for 2018.
Reserves
As of 2017, net proved reserves were 2,527 MMBoe, up 18% year over year. Similarly, reserves have increased for other upstream players like Pioneer Natural Resources Co. (NYSE:PXD) , Cimarex Energy Co. (NYSE:XEC) and Southwestern Energy Co. (NYSE:SWN) in 2017 on a year-over-year basis.
You can see the complete list of today’s Zacks #1 Rank stocks here.
The Hottest Tech Mega-Trend of All
Last year, it generated $8 billion in global revenues. By 2020, it's predicted to blast through the roof to $47 billion. Famed investor Mark Cuban says it will produce "the world's first trillionaires," but that should still leave plenty of money for regular investors who make the right trades early.
See Zacks' 3 Best Stocks to Play This Trend >>
The markets have been sluggish this week as investors hope for a jolt later in the week when AI juggernaut NVIDIA Corporation (NASDAQ:NVDA) reports fourth quarter and year-end...
On Friday, a wave of selling pressure swept across the US equity markets, leaving a trail of losses. The S&P 500 closed down 1.7%, the DOW slid 1.69%, and the NASDAQ tumbled a...
Palantir remains highly valued with a 460x P/E ratio and a 42.5x P/B ratio, far above its peers. The stock's beta of 2.81 signals high volatility, meaning sharp moves in both...
Are you sure you want to block %USER_NAME%?
By doing so, you and %USER_NAME% will not be able to see any of each other's Investing.com's posts.
%USER_NAME% was successfully added to your Block List
Since you’ve just unblocked this person, you must wait 48 hours before renewing the block.
I feel that this comment is:
Thank You!
Your report has been sent to our moderators for review
Add a Comment
We encourage you to use comments to engage with other users, share your perspective and ask questions of authors and each other. However, in order to maintain the high level of discourse we’ve all come to value and expect, please keep the following criteria in mind:
Enrich the conversation, don’t trash it.
Stay focused and on track. Only post material that’s relevant to the topic being discussed.
Be respectful. Even negative opinions can be framed positively and diplomatically. Avoid profanity, slander or personal attacks directed at an author or another user. Racism, sexism and other forms of discrimination will not be tolerated.
Perpetrators of spam or abuse will be deleted from the site and prohibited from future registration at Investing.com’s discretion.